ad
GeologyPetrophysics
Trending

Shale Content | Shale Content and Petrophysical Evaluation

Dual Water Model


The dual water interpretation model sometimes used in the petrophysical analysis of shaly formations (Figure 1) assumes two distinctly different types of water within the formation’s pore spaces: clay-bound and free water (Figure 2).

Shale formation above a shaly sandstone, shale content, Shale composition, Petrophysical analysis, Shale reservoir characterization, Porosity evaluation, Shale mineralogy, Petrophysical properties, Organic matter content, Shale gas potential, Petrophysical modeling, Clay content analysis, Shale permeability, Petrophysical interpretation, Shale formation evaluation, Total organic carbon (TOC), Shale geomechanics, Petrophysical parameters, Brittle shale, Shale facies analysis, Petrophysical logs, Shale porosity types, Petrophysical measurements, Shale core analysis, Effective porosity, Shale pore structure, Petrophysical evaluation methods, Shale water saturation
Figure 1: Shale formation above a shaly sandstone

Close to the surface of the grains is found “near water” or “clay-bound water,” of resistivity RwB. Clay-bound water (Figure 2) is water within the clay lattice, or near the surface within the electrical double layer.

Clay-bound and free water, shale content, Shale composition, Petrophysical analysis, Shale reservoir characterization, Porosity evaluation, Shale mineralogy, Petrophysical properties, Organic matter content, Shale gas potential, Petrophysical modeling, Clay content analysis, Shale permeability, Petrophysical interpretation, Shale formation evaluation, Total organic carbon (TOC), Shale geomechanics, Petrophysical parameters, Brittle shale, Shale facies analysis, Petrophysical logs, Shale porosity types, Petrophysical measurements, Shale core analysis, Effective porosity, Shale pore structure, Petrophysical evaluation methods, Shale water saturation
Figure 2: Clay-bound and free water

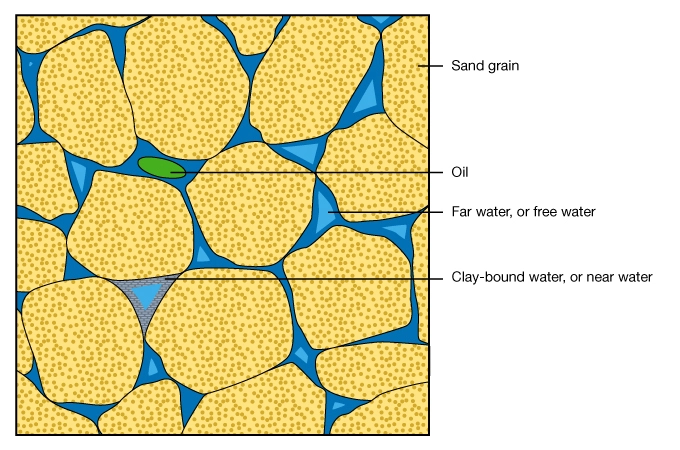
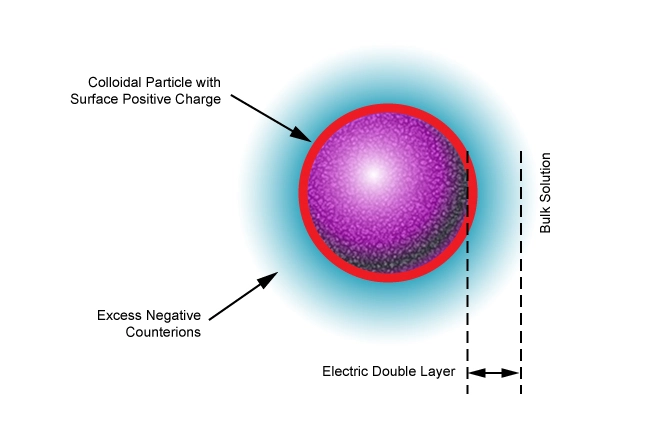
Figure 3 is a simplified sketch of the electrical double layer associated with the surface of clay minerals. Figure 4 illustrates the structure of illite, a common clay mineral found in the subsurface.

Electrical double layer associated with the surface of clay minerals, shale content, Shale composition, Petrophysical analysis, Shale reservoir characterization, Porosity evaluation, Shale mineralogy, Petrophysical properties, Organic matter content, Shale gas potential, Petrophysical modeling, Clay content analysis, Shale permeability, Petrophysical interpretation, Shale formation evaluation, Total organic carbon (TOC), Shale geomechanics, Petrophysical parameters, Brittle shale, Shale facies analysis, Petrophysical logs, Shale porosity types, Petrophysical measurements, Shale core analysis, Effective porosity, Shale pore structure, Petrophysical evaluation methods, Shale water saturation
Figure 3: Electrical double layer associated with the surface of clay minerals
Illite clay structure, clay content, Shale composition, Petrophysical analysis, Shale reservoir characterization, Porosity evaluation, Shale mineralogy, Petrophysical properties, Organic matter content, Shale gas potential, Petrophysical modeling, Clay content analysis, Shale permeability, Petrophysical interpretation, Shale formation evaluation, Total organic carbon (TOC), Shale geomechanics, Petrophysical parameters, Brittle shale, Shale facies analysis, Petrophysical logs, Shale porosity types, Petrophysical measurements, Shale core analysis, Effective porosity, Shale pore structure, Petrophysical evaluation methods, Shale water saturation
Figure 4: Structure of illite


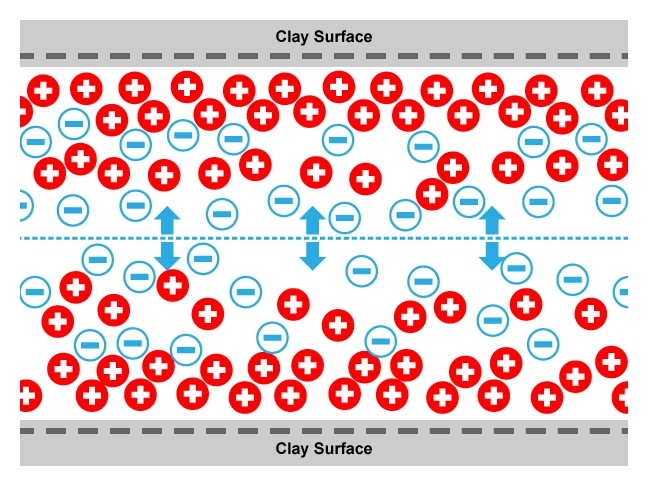
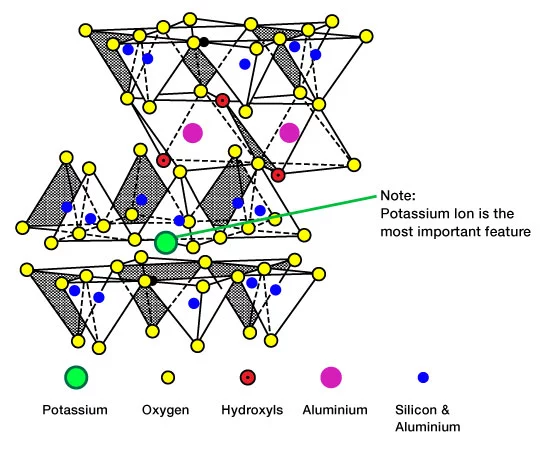
The clay-bound water does not move when fluid is flowed through the rock. Clay-bound water consists of clay counterions (Figure 5) and the associated water of hydration. This water is fresher, and thus more resistive, than the remaining water farther away from the grain surface.

The “far water” or “free water” of resistivity, RwF, is the normal formation water that occurs naturally within the pores of the rocks. This water is more saline, and thus less resistive, than the clay-bound water, and is free to move in the pores of the shaly formations.

Clay counterions, chale content, clay, Shale composition, Petrophysical analysis, Shale reservoir characterization, Porosity evaluation, Shale mineralogy, Petrophysical properties, Organic matter content, Shale gas potential, Petrophysical modeling, Clay content analysis, Shale permeability, Petrophysical interpretation, Shale formation evaluation, Total organic carbon (TOC), Shale geomechanics, Petrophysical parameters, Brittle shale, Shale facies analysis, Petrophysical logs, Shale porosity types, Petrophysical measurements, Shale core analysis, Effective porosity, Shale pore structure, Petrophysical evaluation methods, Shale water saturation
Figure 5: Clay counterions

The dual water model implies that the amount of bound water is directly related to the clay content of the formation. Thus, as the clay volume increases, the portion of the total porosity occupied by bound water increases as illustrated schematically in Figure 6.

Dual water model schematic, dual water, shale content, clay, Shale composition, Petrophysical analysis, Shale reservoir characterization, Porosity evaluation, Shale mineralogy, Petrophysical properties, Organic matter content, Shale gas potential, Petrophysical modeling, Clay content analysis, Shale permeability, Petrophysical interpretation, Shale formation evaluation, Total organic carbon (TOC), Shale geomechanics, Petrophysical parameters, Brittle shale, Shale facies analysis, Petrophysical logs, Shale porosity types, Petrophysical measurements, Shale core analysis, Effective porosity, Shale pore structure, Petrophysical evaluation methods, Shale water saturation
Figure 6: Dual water model schematic

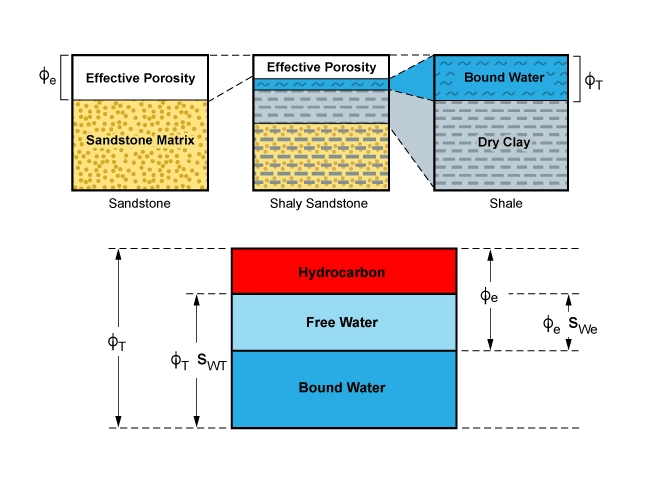
For a water-bearing shaly sandstone, the dual water model proposes a bulk volume of bound water, ϕT×SwB, and a bulk volume of free water, ϕT×Swe, where ϕT is a total porosity. The resistivity model for this mixture of waters requires that the effective mixed water resistivity, Rfluid mixture, is expressed by the equation:

\dfrac{1}{R_{\textrm{fluid mixture}}} = \dfrac{(1 - S_{wB})}{R_{wF}} + \dfrac{S_{wB}}{R_{wB}}

Thus:

R_o = \dfrac{R_{wF}\cdot R_{wB}}{R_{wB} + S_{wB}\cdot (R_{wF} - R_{wB})\cdot \phi _T^2}

In hydrocarbon-bearing sections, the dual water model proposes a bulk volume of bound water, ϕTSwB, a bulk volume of hydrocarbon, ϕT⋅(1−SwT), and a bulk volume of free water, ϕeSwe. The total conductivity of such a system, after taking into account both the clay and the hydrocarbon, leads to the relationship:

C_t = \dfrac{C_w\cdot S_w^2}{F_o} + \dfrac{(C_{wB} - C_w)\cdot V_Q \cdot Q_V\cdot S_w}{F_o}

Where:

CwB= the conductivity of the bound water

(VQ×QV)= the effective product of the amount of clay water and its ability to conduct

Fo= total interconnected porosity

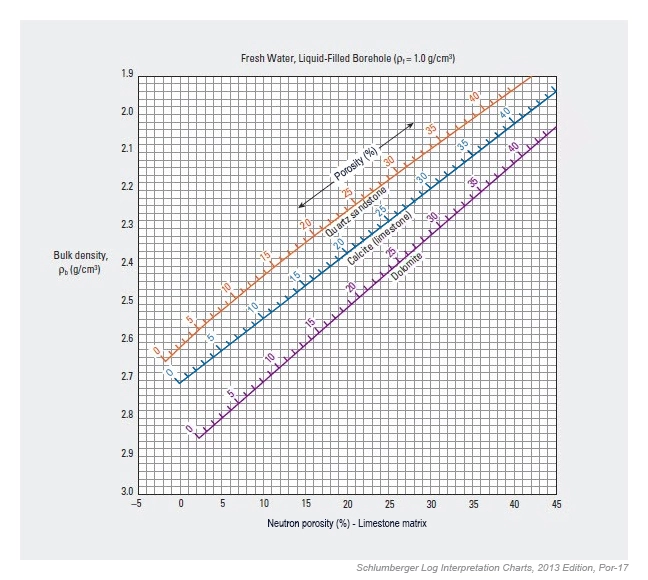
In practice, ϕT is usually taken as the porosity from the neutron porosity versus density crossplot (Figure 7), RwF is considered equal to a conventional formation water resistivity, Rw, and RwB is estimated from resistivity log readings in neighboring shales, making this method somewhat empirical. The density-neutron crossplot template shown is specific to Schlumberger’s 8.25-inch LWD azimuthal density-neutron tool. The appropriate, but very similar, crossplot templates should be used for other density and neutron porosity tools.

Neutron porosity versus density crossplot, shale content, crossplot ND, Shale composition, Petrophysical analysis, Shale reservoir characterization, Porosity evaluation, Shale mineralogy, Petrophysical properties, Organic matter content, Shale gas potential, Petrophysical modeling, Clay content analysis, Shale permeability, Petrophysical interpretation, Shale formation evaluation, Total organic carbon (TOC), Shale geomechanics, Petrophysical parameters, Brittle shale, Shale facies analysis, Petrophysical logs, Shale porosity types, Petrophysical measurements, Shale core analysis, Effective porosity, Shale pore structure, Petrophysical evaluation methods, Shale water saturation
Figure 7: Neutron porosity versus density crossplot


Previous page 1 2 3 4 5 6 7Next page

Related Articles

Leave a Reply

Your email address will not be published. Required fields are marked *

ad
Check Also
Close
Back to top button