Related Articles


Unconventional Resource Shale Reservoirs
The two types of petroleum resources, conventional and unconventional (Figure 1 and Figure 2), generally require quite different approaches for their evaluations.
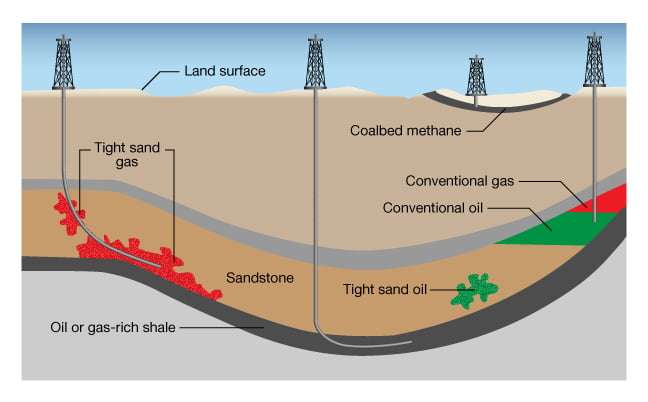
Conventional resources occur in discrete hydrocarbon accumulations related to localized geological structural and/or stratigraphic features, with the accumulation usually bounded by a downdip contact with an aquifer and affected by hydrodynamics and the buoyancy of petroleum in water.
Unconventional resources occur in petroleum accumulations that are pervasive throughout a considerable area and are not affected by hydrodynamics. Consequently, reliance on continuous hydrocarbon/water contacts and pressure gradient analysis to interpret the extent of the recoverable hydrocarbons is not possible. There is, therefore, a need for increased well sampling density to achieve a better understanding of the subsurface and establish the resource categories. Shale oil/gas resources are one of the categories of unconventional resources.

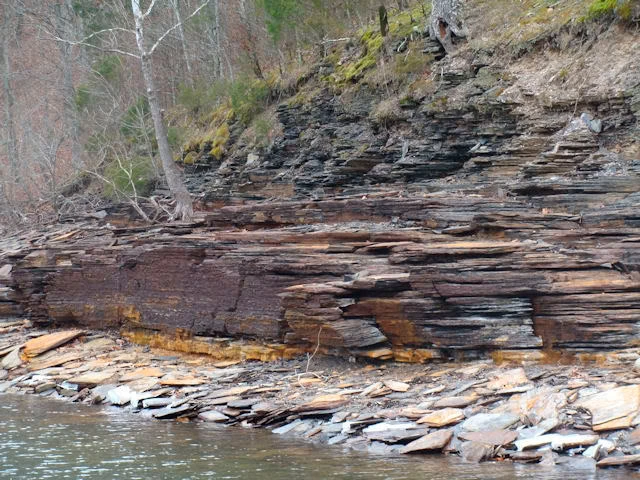
Shale Reservoirs
Shale reservoirs (Figure 3) are composed of a number of porosity types: effective porosity, clay porosity, and micro-porosity associated with the shales, as well as hydrocarbon components such as the total organic carbon (TOC).
The adsorbed hydrocarbons reside in the TOC component, and “free” hydrocarbons are found in the effective porosity and the shale micro-porosity. Shale oil and gas reservoirs have extremely low permeability, which requires hydraulic fracturing, or fracking, of the near wellbore region of horizontal wells (Figure 4) to enable commercial hydrocarbon production rates and volumes (Orangi et al., 2011). Evolving horizontal well technologies, coupled with staged hydraulic fracturing, have made the development of some of these reservoirs an economic reality in certain situations.

Reservoir Quality of Shale Plays
The ultimate quality of a shale reservoir depends on the alignment of numerous parameters to result in high production potential. Accurate characterization of these parameters is crucial to the successful development of a shale oil or shale gas play.
Because shales are typically deposited in deep basinal settings, shale units commonly extend over large areas and, in many systems, make up over 60% of the sedimentary sequence (Alexander et al., 2011). However, shales are not homogeneous—their internal characteristics can vary widely both laterally and vertically. In addition, not all shales have the characteristics necessary for a good hydrocarbon reservoir.
The primary parameters that control the quality of a shale reservoir include:
- Total organic carbon (TOC)
- Thermal maturity of the organics
- Thickness of the hydrocarbon-bearing shale units
- Porosity and permeability of the shale
- Mineralogy
All of these characteristics can vary extensively across a basin even within the same shale interval, and relatively small-scale variability is common. Thus, understanding the patterns of the variations in these parameters as well as the relationships between the parameters is important.
Shale Reservoir Parameters
TOC
The TOC represents the amount of organic carbon present in a shale unit. The remains of plants, algae and small animals that settle downward through the water column onto the seafloor are incorporated into the shale during deposition and are the precursor material for the hydrocarbons that are ultimately stored in the reservoir after thermal maturation. If the deepwater environment is anoxic (oxygen poor), much of the organic carbon will be preserved in the sediments rather than being consumed by aerobic bacteria.
TOC values of hydrocarbon reservoirs generally range from approximately 2% to 10%. TOC can vary widely and at several scales throughout a reservoir. Reservoirs with TOC < 2% do not have sufficient organics in place to form attractive hydrocarbon reservoirs, while those with TOC> 10% are not sufficiently mature to be produced (Alexander et al., 2011). The amount of organics that accumulate at a given location within a shale is a complex function of several processes, including upwelling and mixing in the depositional basin’s water column, the rate of influx of organic material into the basin, the rate of oxidation of the organic material during deposition, the sedimentary influx and burial rates, and the geochemical characteristics of the basin (Passey et al., 2010).
Thermal Maturity
The thermal maturity of the organics will control the type(s) of hydrocarbons that are present in a shale reservoir. Maturity is largely governed by the burial history of the sediments in a basin and is a function of the burial depth, geothermal gradient during basin evolution and the time-scales over which the sediments experienced different temperatures.
As a sedimentary unit is buried, the higher temperatures at depth will begin to affect the preserved organic matter (Figure 5). At temperatures below approximately 50°C, the organic matter will begin to convert to kerogen, and some biogenic methane will be generated by microbial action. At temperatures of 50°C to 150°C, the kerogen continues to break down through the process of catagenesis and begins to form oil and increasing amounts of high-liquids content gas (“wet gas”). Metagenesis at higher temperatures (> 150°C) produces dry gas (Alexander et al., 2011).

In reservoir rocks, the thermal maturity is quantified using vitrinite reflectance (%Ro), as shown in Table 1.
| Table 1: Vitrinite Reflectance and Thermal Maturity | |
|---|---|
| %Ro Value | Thermal Maturity |
| < 0.5 | Immature organic material |
| 0.5 to ~0.8 | Oil generation |
| ~ 0.8 to 1.1 | Wet gas generation |
| > 1.1 | Dry gas generation |
Thickness
The thickness of the shale unit controls the gross reservoir thickness that is available to contain the hydrocarbons. Because shales are deposited in parasequences (which have variable grain sizes, TOC contents and other characteristics), not all of the shale unit is considered to be productive; a fraction of the total thickness of the shale unit will have unfavorable reservoir properties. Thus, the net thickness, rather than the gross thickness, will affect the productivity and resource capability of the reservoir.
Permeability
The permeability of shale is extremely low due to its extremely small sediment particles. Shale permeabilities can be lower than 0.001 mD and range over several orders of magnitude. This matrix permeability is generally too low to permit commercial production rates of oil or natural gas. However, the presence of sets of continuous, laterally-extensive natural fractures can provide additional permeability that can substantially impact the ability of a shale reservoir to be produced via hydraulic stimulation, which can intersect these natural fracture systems.
Mineralogy
The mineralogy of the shale is important because the ductility or brittleness of the rock (and thus its ability to fracture easily) is controlled by the mineral content. The mineralogy of shales varies widely, particularly the proportions of clays, carbonates and quartz. High proportions of clay minerals result in relatively high ductility, which limits the ability of hydraulic fractures to propagate continuously through the rock. In contrast, shales that contain more than 50% quartz and/or carbonate minerals are more brittle and generally reflect better production rates due to the ability of hydraulic fractures to propagate for longer distances (Passey et al., 2010).
Porosity
In shale gas reservoirs, gas is present in the pores, microfractures and fractures as free gas, or the gas is dissolved in liquids and is also adsorbed onto the kerogen. At low reservoir pressures, most of the gas is adsorbed gas, while at higher pressures, free gas makes up the majority of the gas in place. When a shale gas well begins production, the majority of the produced gas is free gas. As the reservoir pressure decreases, a greater proportion of the gas produced is adsorbed gas being liberated by the reduction in pressure.
The complex interaction among all of these variable reservoir characteristics results in shale reservoirs that can be highly variable in reservoir quality both laterally and vertically. Accurate characterization of the reservoir properties, and an understanding of the processes that control the lateral and vertical variations in a given play, are crucial to developing effective drilling and well completion plans, as well as field development strategies that will allow for optimal production and reservoir management operations.
A review of shales as unconventional resource reservoirs is covered in more detail in the IPIMS topic Introduction to Unconventional Resources.
Petrophysical Model for Shale Reservoirs
Digital Formation, Inc. (2012) proposed a petrophysical model to calculate the porosity components in shale, for particular use in shale oil and shale gas unconventional reservoirs (Figure 6).

Digital Formation’s process for determining the porosity in shales is as follows:
- Solve for the density and neutron porosity responses, from either LWD or wireline logs, in the shale part of the formation.
- From a density-neutron crossplot (Figure 7), choose silt, clay 1, and clay 2 to create an envelope encompassing the majority of the data. Choose clay porosity values appropriate to clay 1 and clay 2. For each of the three data points, determine:
- Clay 1 porosity contribution = % clay 1 × clay 1 porosity
- Clay 2 porosity contribution = % clay 2 × clay 2 porosity
- Clay porosity = clay 1 porosity contribution + clay 2 porosity contribution

There are two different methods to calculate the free porosity in shale.
First method:
- Calculate the shale porosity from the density-neutron crossplot.
- Subtract the clay porosity to define the free shale porosity.
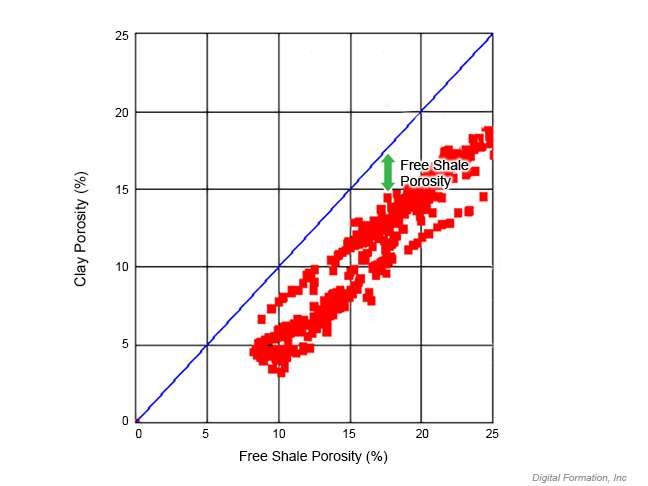
- Compare the clay porosity with the free shale porosity on a crossplot (Figure 8). The free shale porosity should be mostly equal to or greater than clay porosity.
- Add the shale porosity to the effective porosity to define the free available porosity.
If free shale porosity is not mostly greater than or equal to clay porosity, adjust the choice of clay 1 or clay 2 porosity.
Second method:
- On the density-neutron crossplot, identify an envelope occupied by wet clays.
- Quantify free crossplot porosity for data falling to the northwest of the wet clay envelope (Figure 9).
- Add the free crossplot porosity to the effective porosity to define the free available porosity.

Holmes et al. (2014) determine the TOC and clay log responses using an iterative technique. An initial estimate of the TOC properties from the density and neutron logs is subtracted from raw logs to derive a “TOC-free” log response. The clay log responses are defined by subtracting the matrix, effective porosity and silt contributions. The resulting density-neutron crossplot is then compared with the known clay mineral responses to determine if the estimates of the various component log responses are reasonable. A final check of the methodology is to calculate a reconstructed porosity, which is the effective porosity + clay porosity + shale micro-porosity, and see if it agrees with total porosity determined from the “TOC-free” reservoir model.
