Related Articles


Learning Objectives Shale Content Course
After completing this course “Shale Content”, you will be able to:
- Summarize the process for interpreting well logs in:
- Laminated shaly sandstone formations
- Formations containing dispersed shales
- Formations containing structural shales
- Contrast the interpretation issues of conventional and unconventional resource shale reservoirs.
- Summarize the cation exchange capacity interpretation model.
- Summarize the dual water model for evaluating shaly formations.
Shale content and petrophysical evaluation play crucial roles in the field of geology and oil exploration. Understanding the composition and characteristics of shale formations is essential for assessing their potential as hydrocarbon reservoirs. In this article, we will delve into the significance of shale content and the methods used in petrophysical evaluation, shedding light on their importance in the oil and gas industry.
Introduction: Understanding Shale Content and Petrophysical Evaluation
Shale, a fine-grained sedimentary rock, holds significant importance in the energy industry due to its potential as a source rock and reservoir. Shale content refers to the percentage of shale within a rock formation. Petrophysical evaluation involves the analysis of various physical properties of rocks, including porosity, permeability, and saturation. This evaluation aids in determining the viability of shale formations for hydrocarbon extraction.
Shale Content: Composition and Formation
Shale is primarily composed of clay minerals, silt, and organic matter. The deposition of fine particles in quiet environments, such as deep lakes or marine basins, leads to the formation of shale. Over time, compaction and cementation transform the deposited material into solid shale rocks. The content of shale in a formation can vary, ranging from a few percent to predominance.
Laminated Shaly Sandstone Model
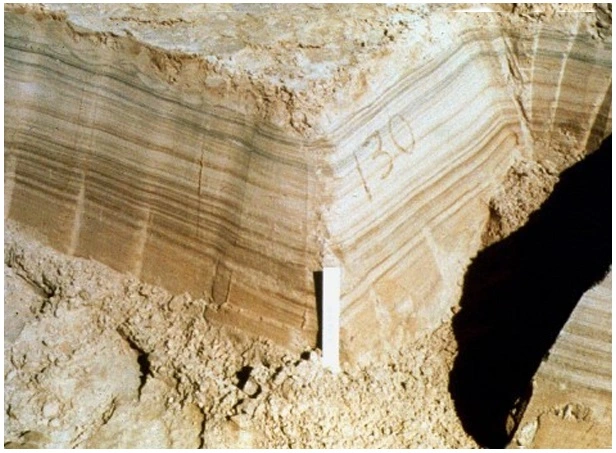
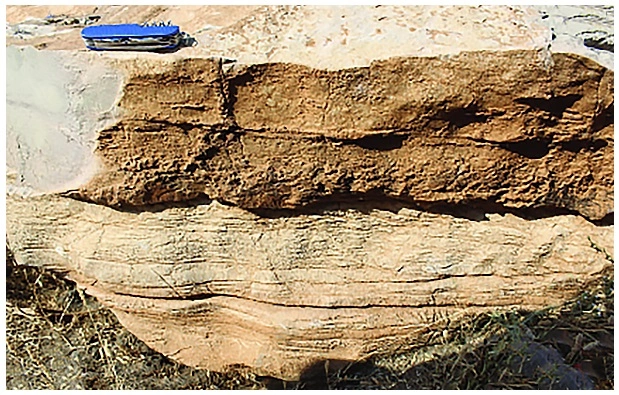
Laminated, shaly sandstone geological models consist of a multi-layer sandwich of alternating layers of generally clean sandstones and shales (Figure 1), which are often predominantly lithified clay materials. The laminations are usually at a smaller scale, and are less pronounced, than the bedding layering. Laminations are often planar structures of one centimeter, or even less, in thickness (Figure 2).
Consequently, the thickness of each layer is relatively small compared to the vertical resolutions of the various porosity and resistivity well logging devices routinely used to log laminated shaly sandstone intervals, whether the data are acquired by logging while drilling (LWD) or wireline. There is therefore a tendency for both porosity and resistivity well logging devices to measure an averaged value of adjacent laminae that is neither a true indicator of the properties of the clean sandstone nor of an individual shale layer, but a composite of both.
Figure 3 schematically illustrates that, as the proportion of the shale laminae (Vlam) increases, the amount of clean sandstone is correspondingly reduced.

Porosity
The porosity within the various clean sandstone laminae remains essentially unchanged, but there is progressively less and less of the clean sandstone present within the whole section.
In the laminated shaly sandstone model, the porosity measured by a density well logging tool, ϕD, is:

Where:
ϕDsh= apparent density porosity in the shale
Vlam= proportion of the shale laminae within the logged interval expressed as a decimal
ϕe= true porosity in the clean sandstone
A similar format equation can be established for the neutron porosity log:

Where:
ϕNsh= apparent neutron porosity in the shale
Vlam= proportion of shale laminae within the logged interval expressed as a decimal
ϕe= true porosity in the clean sandstone
Combining these two equations results in equations for the true porosity in the clean sandstone and shale content in laminated shaly sandstone:

and

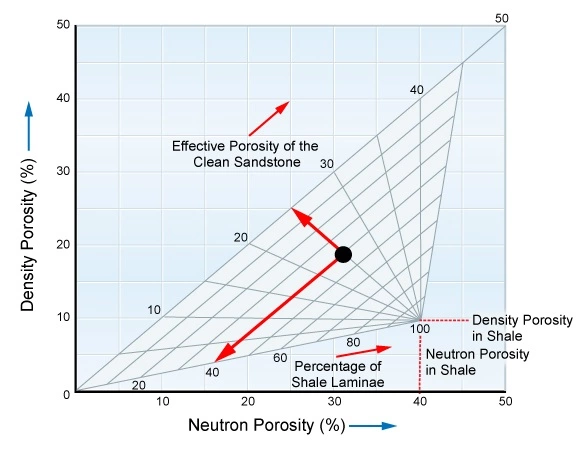
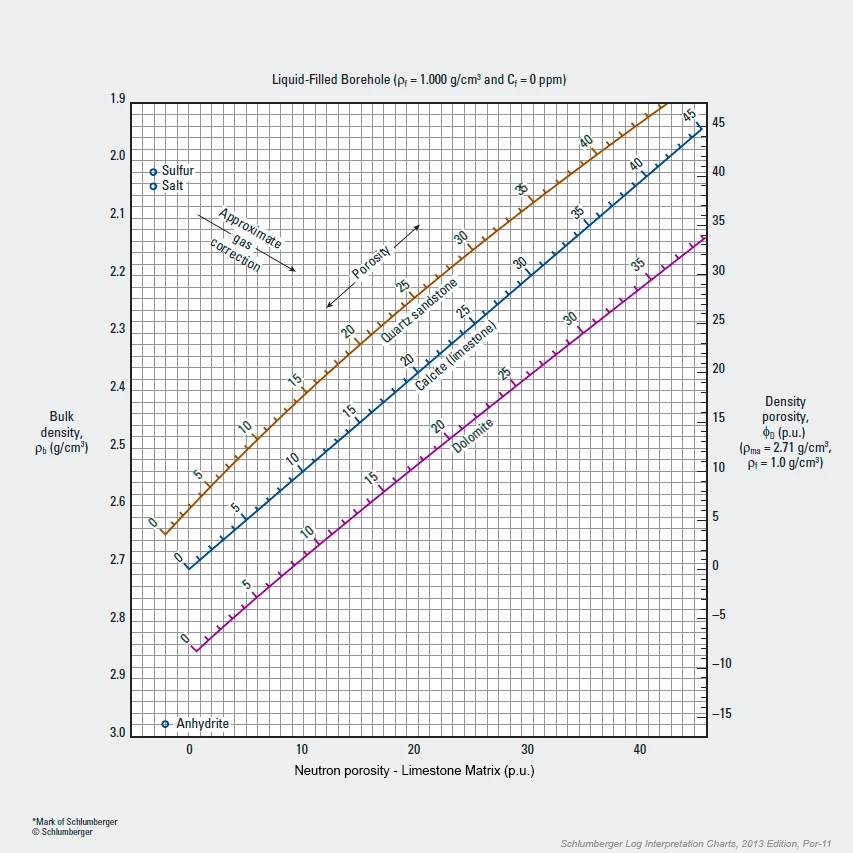
This is represented graphically in Figure 4 for a situation where:
- Density porosity = 19%
- Neutron porosity = 31%
- Neutron porosity in shale = 40%
- Density porosity in shale = 10%
In this case, the true porosity of the clean sandstone is determined to be 25%, and the proportion of shale laminae is determined to be 40%.
Water Saturation
The associated laminated shaly sandstone water saturation model assumes two resistivities in parallel: that of the shale and that of the sandstone. This may be expressed as a measurement of the deep resistivity, Rt, being that of the parallel resistivity of the sandstone and shale fractions. The total rock conductivity is the weighted sum of the conductivities of its two components:

If Csandstone is considered to be the conductivity of the traditional Archie equation (1942), then:

and

The water saturation, Sw, will be related to the other parameters by the equation:

Where Rsh is the shale resistivity.
Rearranging this equation to make the water saturation, Sw, the subject:
![S_w^n= \left( \dfrac{1}{R_t} - \dfrac{V_{lam}}{R_{sh}} \right)\cdot \left[ \dfrac{a\cdot R_w}{\phi _e^m \cdot (1 - V_{lam})} \right]](https://petroshine.com/wp-content/ql-cache/quicklatex.com-0ac1305e91ab05d45607a1c1cfeae07f_l3.png "Rendered by QuickLaTeX.com")
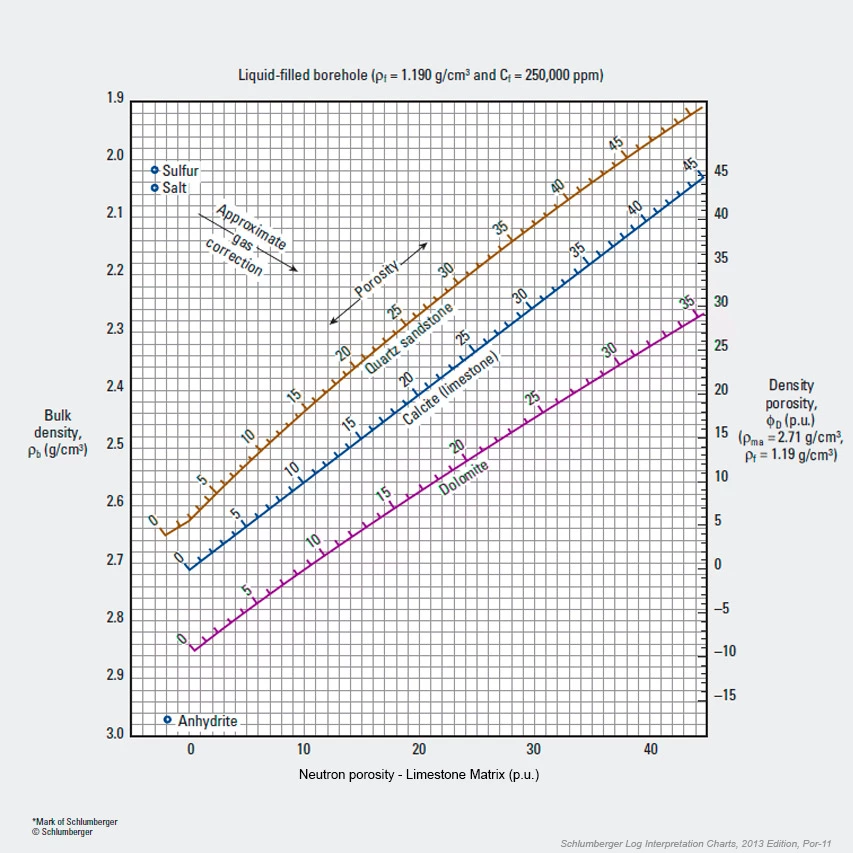
Whenever ϕe is available from a neutron porosity versus density crossplot, it should be used. Such crossplots are somewhat generic in overall format and appearance, but in fine detail they are only strictly applicable for specific tools from specific log data acquisition service companies in specified borehole environments. As examples, Figure 5 is only for use with Schlumberger’s CNL Compensated Neutron tools and Litho-Density tools in cases where fresh water base mud filtrate is present in the invaded zone. Figure 6 is only for use with Schlumberger’s CNL Compensated Neutron tools and Litho-Density tools in cases where salt water base mud filtrate is present in the invaded zone.
If only one porosity device is available, the density porosity is much preferred, provided extreme borehole rugosity does not cause the pad to read mud rather than formation density, and ϕe may be approximated as:

Where Vlam is estimated from another indicator, such as a natural gamma ray, spectral gamma ray or spontaneous potential (SP) log.
The interpretation method incurs difficulties when the resistivity logging device takes measurements from the sandwich not as a parallel system, but as a series or hybrid system. Depending on the geometry of the laminated sandstone, the electrode placement on the particular resistivity tool and the mode of measurement, the resistivity tool may in fact detect the sandstone and shale layers in the sandwich in series rather than in parallel.
The hydrocarbon pore volume can be determined using the formula:

where h is the interval thickness.
This is because in each foot of formation, only the element ( 1−Vlam) will actually be sandstone at porosity ϕe and water saturation Sw.
The laminated shaly sandstone model should be used where the individual laminations are small with respect to the vertical resolution of the well logging devices. Over recent years, LWD and wireline well logging tools have been developed with progressively increasing vertical resolution. However, all oil companies have a range of vintages of well logs acquired over shaly sandstone formations in their databases. The interpretation model to be used to interpret each of such well log suites will, consequently, need to reflect the specific vintage and type of well log suite and its corresponding vertical resolution.
Currently, only dipmeters and borehole imaging logging devices resolve such fine laminations as shown in Figure 7, which are beyond the vertical resolution of routinely used porosity and resistivity tools.