Introduction
In oil reservoirs solution gas drive takes place when the reservoir pressure drops below the bubble point of the reservoir fluid and gas is liberated from the oil.
The expanding volume of liberated gas helps to push fluids from the reservoir. When an oil accumulation has a free gas cap, gas cap drive can occur as the reservoir pressure drops and the gas cap expands, driving oil to the producing wells.
A natural water-drive mechanism relies on the influx of expanding water to sustain reservoir pressure and drive the oil and gas into the producing wells. A fifth drive mechanism, gravity drainage, involves the rearrangement of fluid distributions in the reservoir due to density differences.
Gas tends to migrate upward forcing a countercurrent of oil flow downward causing a higher oil saturation downdip and less resistance to oil flow toward the producing wells.
Also, the force of gravity acting on the fluid column in the reservoir is important in steeply dipping formations with downdip completions.
Gas Reservoirs
Gas reservoirs are hydrocarbon reservoirs that contain dry gas (i.e., the methane mole fraction is greater than 95%). Behavior of these reservoirs is governed by the gas equation of state and the material balance equation. Three quantities—pressure, volume, and temperature—define the state of a gas. As we mentioned, in most hydrocarbon reservoirs the temperature is considered to be constant.
Gas Equations of State
Ideal Gas Equation:
The Ideal Gas Equation of state is derived from Boyle’s law, Charles’ or Gay Lussacs’ law, and Avogadros’ law:
![]() ……….. (18)
……….. (18)
where:
p= pressure, psia
V= volume, ft3
n= number of pound-moles
R= gas constant = 10.732
T= temperature, ºR=460+ºF
W= weight, lb
M= molecular weight, lb/lb-mole
Equation 18 is used to calculate the number of moles of gas when the pressure and volume are known. This allows the determination of the moles of gas left in the reservoir as the Pres sure declines, and thus recovery in moles. However, each mole of any ideal gas occupies a volume of 379.4 ft3 (10.74 m3) at 60º F (289º K), and 14.7 psi (101 kPa). Therefore, recovery in standard volumes is:
379.4 number of moles recovered = standard ft3
or
0.74 number of moles recovered = standard m3
Real Gas Equation:
While Equation 18 is used in many calculations not pertaining to hydrocarbon systems, it was found that the behavior of hydrocarbon systems deviates from the ideal or Perfect gas law. The deviation from ideal behavior increases with pressure and decreases with temperature. This deviation is attributable to the fact that the perfect gas law assumes that the kinetic motion of gas molecules (i.e., their tendency to fly apart) is much stronger than the electrical attractive forces. This assumption is not valid at high pressure and relatively low temperature. Under most reservoir engineering pressure conditions, the molecules are brought close to each other, and the attractive forces become important. To correct for the deviation from ideal gas behavior, a gas deviation fac tor, or compressibility factor, is introduced into Equation 18. It becomes
![]() ……….. (19)
……….. (19)
where z is the dimensionless deviation, or gas compressibility, factor.
z-Factor Correlations:
The z factor may be obtained from correlations given in Katz 1959 and Standing and Katz 1942. The correlations give z as a function of pseudoreduced temperature and pressure
These quantities are defined by
![]() and
and ![]()
where Pc and Tc are the pseudocritical pressure and temperature for the hydrocarbon system. (The critical temperatureis the temperature at which the meniscus that separates the liquid and vapor phases of a fluid disappears. The vapor pressure at this critical temperature is called the critical pressure. Above the critical temperature, there is no reason to draw any distinction between liquid and vapor, since there is a complete continuity of states.)
The preferred way to obtain Pc and Tc is by calculating them from a gas compositional analysis, i.e.,
![]() ……….. (20)
……….. (20)
![]() ……….. (21)
……….. (21)
where:
ni= mole fraction of component i
Pci= critical pressure of component i
Tci= critical temperature of component i
The sum is taken over all the components. Pci and Tci are listed in Katz et al. (1959) and Standing (1952) and are given in Table 1.
Critical Pressure and Temperature Values
| Component | Pc, Psia | Tc, ′R |
|---|---|---|
| Methane | 668 | 343 |
| Ethane | 708 | 550 |
| Propane | 616 | 666 |
| Isobutane | 529 | 735 |
| Normal Butane | 551 | 765 |
| Isopentane | 490 | 829 |
| Normal Pentane | 489 | 845 |
| Normal Hexane | 437 | 913 |
| Normal Heptane | 397 | 972 |
| Normal Octane | 361 | 1024 |
| Normal Nonane | j32 | 1070 |
| Normal Decane | 304 | 1112 |
| Carbon Dioxide | 1071 | 548 |
| Hydrogen Sulfide | 1306 | 672 |
| Nitrogen | 493 | 227 |
Equations 20 and 21 require knowledge of the gas composition. If this is not available one may use correlations given in Katz 1959. These give Pc and Tc values as functions of gas gravity.
Application of the Real Gas Equation of State
Volumetric Calculations
Equation 19 may be used simply to calculate the number of moles, and thus the standard cubic feet of gas in a gas reservoir. The value of z can be less than, equal to, or greater than 1.0. It very seldom exceeds a value of 1.10. However, it can be as low as 0.3.
p/z versus Cumulative Production
We mentioned that the equation of state together with the material balance equation defines the behavior of a gas reservoir. The MBE for a gas reservoir with no water influx and neglecting compressibilities of rock and its associated water is
![]() ……….. (22)
……….. (22)
where:
Gp = cumulative gas produced, SCF [m3]
Bg = gas formation volume factor, Reservoir volume/standard volume (CF/SCF [m3/std m3])
G = original gas in place, SCF
Bgi = initial gas formation volume factor, taken at the initial reservoir pressure (pi) Reservoir volume/standard volume (CF/SCF [m3/std m3])
Bg is calculated as follows:
![]() ……….. (23)
……….. (23)
where the subscript “sc” indicates standard conditions and is expressed as absolute temperature, and ![]() and
and ![]() represent average pressure and temperature, respectively, at reservoir conditions.
represent average pressure and temperature, respectively, at reservoir conditions.
Thus, for standard conditions of 14.7 psia and 60°F (520°R), and where Bg is expressed in reservoir barrels per standard cubic feet (1 Bbl = 5.615 ft3),
![]()
Substituting for Bg in Equation 22 and simplifying gives
![]() ……….. (24)
……….. (24)
This equation shows that a plot of Gp versus p/z in rectangular coordinates should result in a straight line. The extrapolation of the straight line to any p/z value gives the total recovery at that pressure value, and its extrapolation to p/z = 0 gives the initial gas in place (Figure 1).
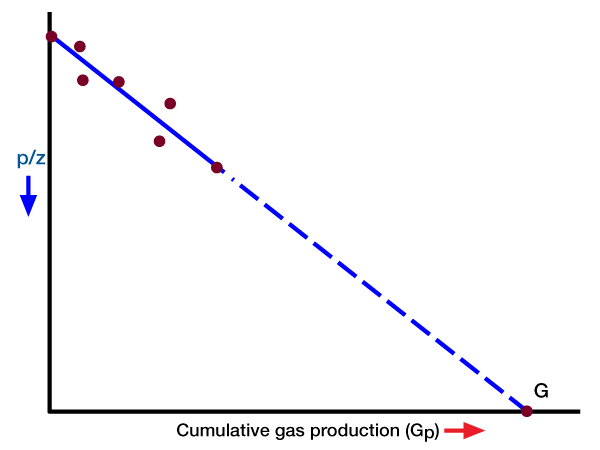
The p/z plot is used in the petroleum industry to predict gas recovery versus pressure, and initial gas in place. It is evident that some pressure and production data are required to establish a straight line. The more data that becomes available, the better the definition of the straight line, and the more accurate the prediction. One must always remember that we are usually dealing with field data where inaccuracies are present, and where scatter occurs. Therefore, any p/z plot should be routinely updated as pressure and production data allow.
Effect of Water Influx If water influx is present, Equation 22 becomes
![]() ……….. (25)
……….. (25)
where We is the water influx. Equation 24 becomes
 ……….. (26)
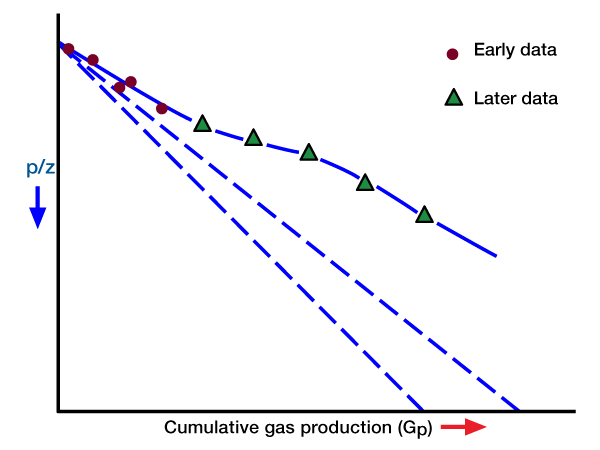
Since We is a function of pressure and time (i.e., it is not constant), and Bg is a function of pressure, a plot of Gp versus p/z will not give a straight line. However, at early time We is normally small, and, because of this, the plotted points may appear to fall on a straight line. Such a straight line will have a relatively flat slope, and its extrapolation to p/z = 0 will give an erroneously high value for G. Later tine production data will not continue on a straight line trend. Rather, they will curve with a slope as shown in Figure 2.
Recovery Factors
Gas recovery by pressure depletion usually is the most efficient means of producing gas reservoirs and results in a maximum recovery. Recovery can easily be calculated by Equation 24, and requires an estimate of the level of abandonment pressure. This recovery can also be approximated by
![]()
When water influx is present, recovery is adversely affected because of the tendency for the encroaching water to trap portions of the gas in the reservoir, perhaps 15 to 50% or more. This trapped gas is unrecoverable. In addition, heterogeneities and stratification may cause the encroaching water to bypass a por tion of the reservoir and prematurely “water out”the producing wells. Generally speaking, when water influx is present, reservoir and production engineers may try to “outrun” the water by producing the gas at a high rate. This tends to maxi mize the effect of the expansion part of the recovery mechanism, before the water can move into the gas-saturated portion of the reservoir. The success of such a technique depends to a large extent on the permeability characteristics and geometry of the reservoir rock, the reservoir aquifer sys tem, and the location of the producing wells. Other strategies for handling water influx, as outlined by the Gas Research Institute in its publication Managing Water-Drive Gas Reservoirs (1993) include
- continuing to produce watered-out wells in order to lower reservoir pressure and thus remobilize trapped gas,
- selectively recompleting wells with multiple horizons,
- drilling additional wells to avoid bypassing reserves,
- increasing off-season takes to maximize the net present value of reserves.
Abnormal-Pressure Gas Reservoirs
Abnormally pressured gas reservoirs are those reservoirs whose average fluid pressure gradient is substantially higher than 0.433 psi/ft (9.796 kPa/m), which is the average for normally pressured reservoirs. Abnormal pressures can result from a number of conditions, some of which include undercompaction of sediments, chemical diagenesis, tectonic activity (e.g., faulting), fluid density differences and fluid migration. For such reservoirs, the effective rock compressibility could be several orders of magnitude higher than that of normal reservoirs.
p/z Behavior
In applying the MBE to gas reservoirs with no water influx, it is normally assumed that the rock and its associated water expansion is insignificant compared to that of the gas expansion and is normally ignored. This assumption underlies the linear p/z versus cumulative production plot. In the case of abnormally pressured gas reservoirs, the compressibility of the rock cannot be ignored. It acts to maintain the pressure at a relatively high value. Thus a plot of p/z versus cumulative gas production for these reservoirs will show two distinct slopes (Perez and Robinson 1976). The early slope exists during the period of abnormally high pressure (because of gas expansion, as well as pressure maintenance resulting from formation compaction, crystal expansion and water expansion), and the later one characterizes the reservoir when the pressure reaches the normal value (Figure 3).
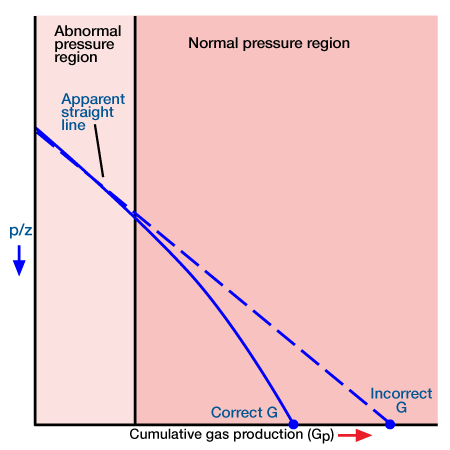
Extrapolation of the early slope to obtain initial gas in place will result in an optimistic value. In this sense it is similar to the p/z plot when water influx is present, as discussed earlier. If the second straight line is adequately defined it may be extrapolated to obtain an estimate of the initial gas in place. If only the first slope is defined the engineer is advised against using the p/z technique for determining gas in place: instead, the MBE with compressibility terms should be used.
Material Balance Equation with Compressibility Terms
The MBE for a gas reservoir with no water influx is
![]()
The first term on the right-hand side is the gas expansion and the second term is the expansion of the rock and associated water. The left-hand side term is the gas production. All are expressed in reservoir volumes. The initial gas in place G is then
 ……….. (27)
Equation 27 should be used to calculate the initial gas in place, in place of the normal p/z versus Gp plot for abnormally pressured reservoirs.
 Petro Shine The Place for Oil and Gas Professionals.
