Related Articles


Crossplots
Crossplots of well log data are indispensable tools for the well log analyst for interpreting both logging while drilling (LWD) and wireline well log data. The basic crossplot concept is a two-dimensional representation of the variation of log data with respect to two or more properties. Although the dominant usage is the efficient computer processing of digital log data, manual crossplots can be useful for quickly analyzing data from a few key intervals in a well.
A main objective of using a crossplot is to establish a petrophysical parameter needed for quantitative log analysis, such as the formation water resistivity or water saturation. Figure 1 is a graphical representation of the Archie equation, showing a crossplot of porosity versus resistivity.

Within a given formation, the Ro line that is representative of 100% water saturation is established. Away from this 100% water saturation line, those data points which are indicated to have significantly lower water saturations can be further analyzed.
Crossplots can also be used to investigate whether there are distinctively different, but internally coherent, zones within a logged section. If a logged section can be carefully zoned, consistent and appropriate parameters can then be used within each zone to enhance the log interpretation. Figure 2 shows a density-neutron crossplot used to divide a logged section into three distinct zones. For example, the lowest interval, highlighted in green for both the crossplotted points and the stratigraphic column, is a coherent and distinctive limestone zone of intermediate porosity, ranging from 10% to 20%, with some minor dolomitization.

Trend Analysis and Parameter Relationships
Crossplots can be used to discern trends and parameter relationships. After the analysis of full diameter cores, a plot of permeability against porosity can be used to distinguish three different rock types (Figure 3) within the cored interval.

Rock type A is of low porosity and low permeability, rock type B is of moderate porosity and high permeability and rock type C is of high porosity and moderate permeability. Thus, crossplots are useful indicators of groupings of the petrophysical data points that help petrophysicists better interpret the log data by zoning.
Extrapolations and Interpolations
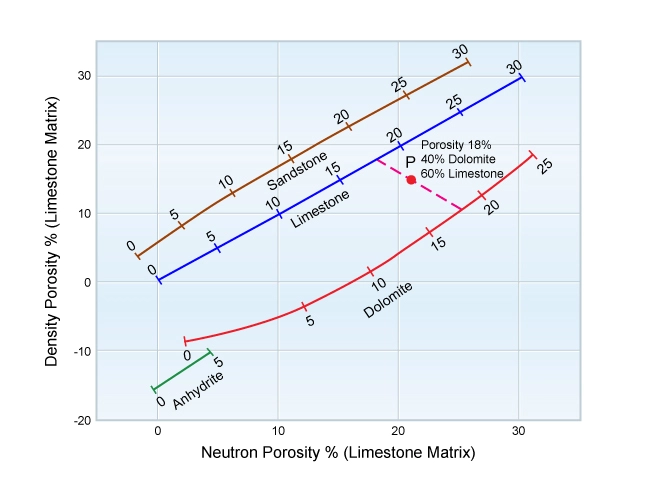
Another useful application of the crossplot is extrapolations and interpolations—a valuable tool for predicting such key parameters as formation porosity. In Figure 4, data from one logged level with a density porosity of 15% and a neutron porosity of 21% are plotted. This establishes the point P on the crossplot, lying between the limestone and dolomite matrix lines and falling on a line connecting the 18% porosity graduations on these two lithology matrix lines. Assuming a mixed limestone and dolomite formation and proportioning the distance between the two matrix lithology lines, the point corresponds to a volumetric proportion of about 40% dolomite and 60% limestone, with a porosity of 18%.
Frequency Plots
Computers rapidly manipulate digital log data to generate a number of frequency crossplots. These frequency crossplots show the number of occurrences of a particular pair of log data points. Figure 5 is a neutron density frequency crossplot for data from a section logged through a sandstone and shale sequence.

Each data level on the log has its density and neutron porosity coordinates located on the plot. Whenever several points fall within the same cell, their total number is accumulated, and this frequency number is plotted. Where no data are found, that area of the plot remains blank. The area of the plot occupied by the majority of the points gives a visual image of the distribution of the formation properties in the logged section.
Z Plots
The Z plot is a companion plot to the conventional frequency crossplot, or X–Y plot. The objective of the Z plot is to map the distribution of three variables simultaneously. This is accomplished by indicating the scaled average of the third variable, Z, at each X–Y cell address.
In Figure 5, there were eight occurrences of log data points with a neutron porosity of 26% and a density porosity of 12%. The same cell on the Z plot of Figure 6 shows a scaled average of a third parameter, the natural gamma ray. The scaled average of the eight values of gamma ray occurring at the points with a neutron porosity of 26% and a density porosity of 12% is seen to be 8. On this particular plot, the scaling of the z-axis was accomplished using the formula:

zmin and zmax were chosen so that the least radioactive levels with the lowest gamma ray readings were assigned a value of 0 and the most radioactive levels were assigned a value of 10.
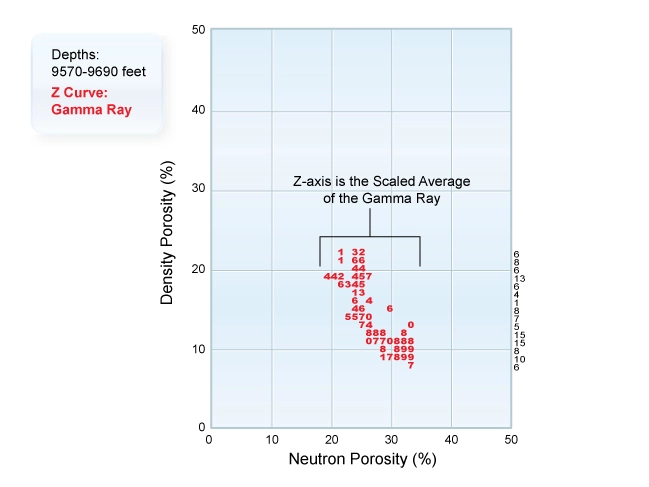
Reviewing the Z plot of Figure 6, points with the highest shale content indicated by z values of 8, 9 and * lie to the southeastern corner of the plot. The least radioactive points with low z values of 1, 2 and 3 lie to the northwestern part of the plot. Z plots are useful for data analysis where three variables are of interest.
