Paleothermometry
The geothermal gradient was often higher when a basin was active than it is today. Therefore, we need accurate paleothermometers to measure the maximum temperature to which a particular source rock was exposed. Some paleothermometers are based on the physical and chemical properties of kerogen, while others rely on rock properties.
After determining kerogen type using microscopy, we can evaluate the degree of maturation of a particular kerogen with the Van Krevelen diagram (Figure 1). For all types of kerogen, more hydrogen and oxygen is lost relative to carbon as maturation progresses. We analyze hydrogen, carbon and oxygen contents of kerogens chemically and plot them as ratios.

For some kerogen macerals, such as spores and pollens, color can serve as a paleothermometer. Initially, these macerals are colorless. With heat, they change progressively to greenish-yellow, yellow, orange, reddish-brown, dark brown and ultimately black. The color indicates the highest temperature reached by the source rock.
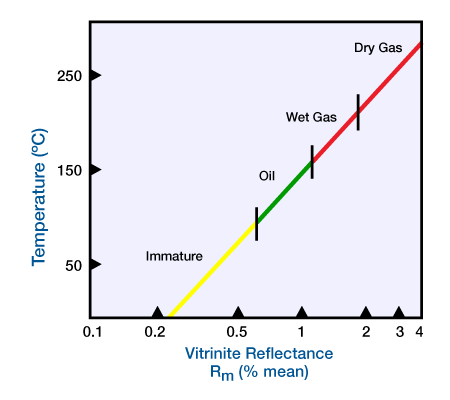
As kerogen is heated, the reflectivity of vitrinite increases gradually. We use a reflecting microscope with a photo-multiplier to measure this reflectivity. This technique is useful because vitrinite is the most extensively dispersed maceral in sedimentary rocks. A linear increase in temperature increases the reflectivity of vitrinite exponentially, which plots as a straight line on semi-log paper (Figure 2).

We use the percent mean reflectance, Rm, averaged from several measurements, because individual reflectances vary with plant tissue type and grain orientation as seen with a microscope. Crude oil generation occurs for Rm values between 0.6 and 1.2 percent. Values of Rm between 1.2 and 2 percent signal generation of wet gas, while values from 2 to 4 percent indicate generation of dry gas.
We can also use source rock minerals to gauge paleotemperature. Swelling clays, such as montmorillonite, contain a significant amount of structurally bound water. As temperature increases, these clays dewater, gradually losing their mixed layers and becoming more ordered. We use x-ray diffraction techniques to calibrate the systematic loss of layers to temperature. At approximately the optimal temperature of the oil window (80 to 120 degrees C), mixed-layered clays and montmorillonite ultimately transform into other types of clays, such as illite and chlorite.
We can also use x-ray diffraction to measure this temperature-related change through the improvement in illite crystallinity. As temperature increases, peaks made by illite on x-ray diffraction patterns become sharper, narrower and more symmetrical. Various methods are used to calibrate this effect with temperature. Clay mineral diagenesis is affected by factors other than time and temperature, such as the chemistry of pore waters. Therefore, paleothermometers based on clay diagenesis may be less precise than kerogen-based methods.
Despite their differences, we can correlate these paleothermometers to each other and to the temperatures of oil and gas generation. We can also correlate these paleothermometers to other maturation indicators, such as exinite fluorescence and electron spin resonance. We should use at least two different paleothermometry methods to assess the maturity of a particular source rock.
 Petro Shine The Place for Oil and Gas Professionals.


