Related Articles


Learning Objectives
After completing this topic “Logging Tools For Evaluating Low Resistivity And Low Contrast Pay“, you will be able to:
- Describe the limitations of the basic, conventional logging tools for evaluating low resistivity and low contrast pay.
- Be conversant with specialized logging tools used for evaluating low resistivity and low contrast pay.
- Summarize the applications of specialized logging tools for interpreting low resistivity pay formations.
- Reference case studies to support the use of specialized logging tools for low resistivity pays.
By completing this topic and then applying the learnings in your job, you will be able to attain Basic Application Competence Level in the logging tools aspects of low resistivity and low contrast pay interpretation.
Basic, Conventional Logging Tools
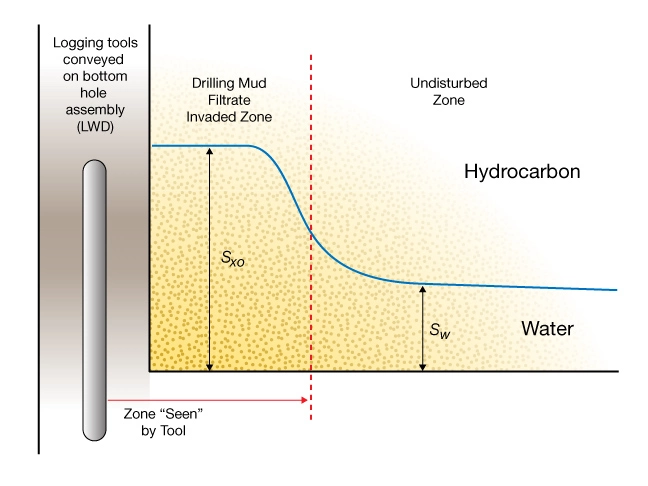
Most basic logging tools must strike a balance between their vertical and horizontal measurements. In well logging terminology, log measurements are a compromise between their vertical resolution and their horizontal depth of investigation. This causes interpretation challenges in thinly laminated, shaly sandstones. Ideally, deep resistivity logging tools would measure deep enough into the formation to get beyond the drilling mud invaded zone (Animation 1) to measure the true formation resistivity of the undisturbed zone (Figure 1). Ideally, we would like the log measurements to be no thicker than the thinnest bed, or lamination. This goal is not always realized with conventional resistivity tools, as some thin beds or laminated zones may be thinner than the vertical resolution of standard logging while drilling (LWD) and wireline logging tools.
Invaded zone adjacent to the borehole wall where mud filtrate has flushed away some of the original formation fluids
A characteristic of many conventional induction logging tools is a decrease in their vertical resolution as the horizontal depth of investigation increases. This often means that the thinnest interval that a conventional induction tool can resolve is acquired by the shallowest reading curve, closest to the wellbore. The true resistivity, Rt, measurement of the deepest reading curve is often not able to resolve intervals that are as thin as those seen by the shallowest reading curve.
Measurement Averaging
A conventional induction resistivity tool of an older, but still current, vintage might have a radial depth of investigation of about 5 ft (1.5 m) for the deep induction curve and a vertical resolution of about 40 inches (1 m). Clearly, such a tool will not be able to successfully resolve very thin laminations. Such an induction tool will average the readings, turning all of those fine laminations of sandstone and shale into a gross average of the smallest thickness that the tool can measure.
Effects of Shale and Clay
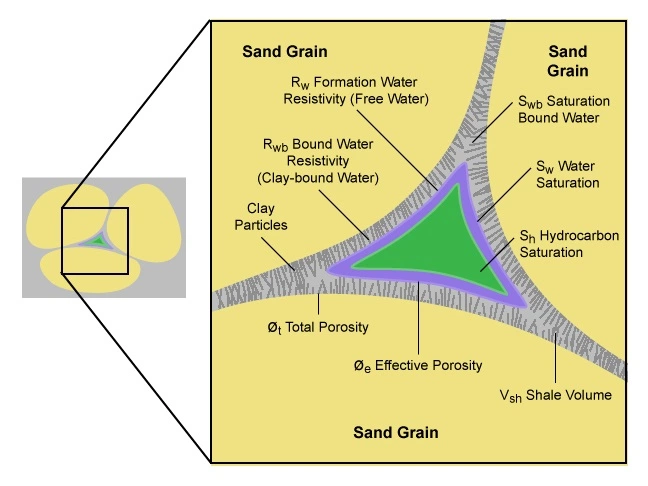
The leading causes of shaly sandstones with low resistivity pay are their content of shale and clay (Figure 2) with the associated bound water (Figure 3). Thus, shale and clay cause conventional resistivity logs to read too low, while causing porosity logs to read too high in most situations.
Spontaneous Potential (SP) Logs
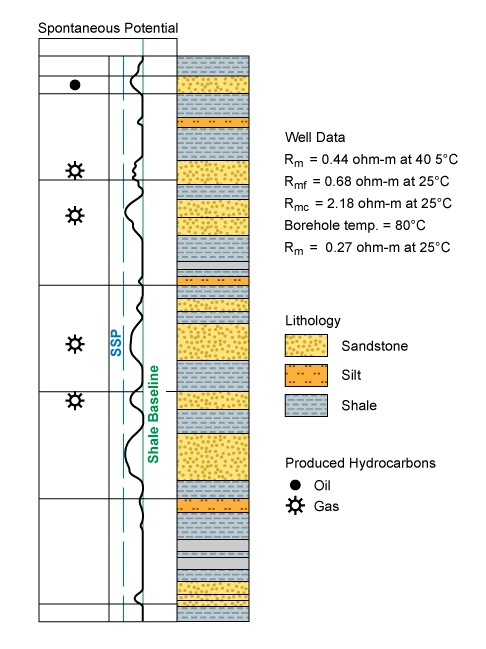
The spontaneous potential (SP) curve is a reasonable indicator of the formation grain size, from which shale and sandstone baselines (Figure 4) can be established. Shaliness will cause the SP curve to deflect toward the shale baseline, provided there is a significant contrast between the salinities of the drilling mud filtrate and the formation water. This deflection between the clean sandstone line and the shale baseline provides one method to estimate the shale volume. The magnitude of the SP deflection is a function of the cation exchange capacity (CEC), formation water resistivity, mud filtrate salinity and water saturation. The presence of hydrocarbons in the formation suppresses the SP response.
Gamma Ray Logs
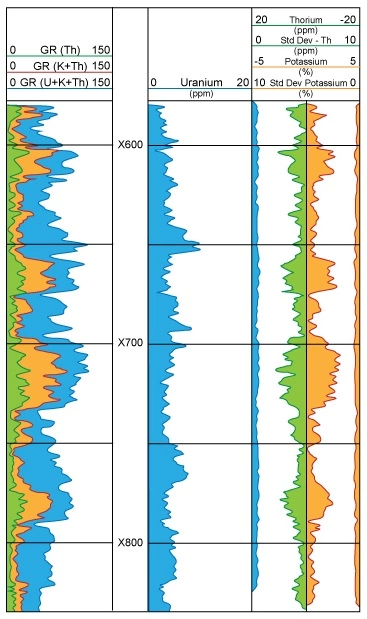
The various types of natural gamma ray tools measure the formation’s natural radioactivity. If a clay and shale mixture does not vary, and if no other radioactive minerals are present in the formation, then the gamma ray log can be calibrated to help estimate the shale volume. In general, the gamma ray will deflect to the right with a higher API count in most clays and shales. However, not all shales will be particularly radioactive and some sandstones, such as those with a high content of potassium feldspars, can be radioactive. In such cases, a spectral gamma ray can be more illustrative, separating out the potassium, thorium, and uranium contributions (Figure 5).
Resistivity Logs
A formation’s resistivity is lowered as a result of the surface charge of clay and shale, as well as its bound water content. These factors, in turn, depend on the surface area and the cation exchange capacity of the clays and shales, in addition to formation compaction.
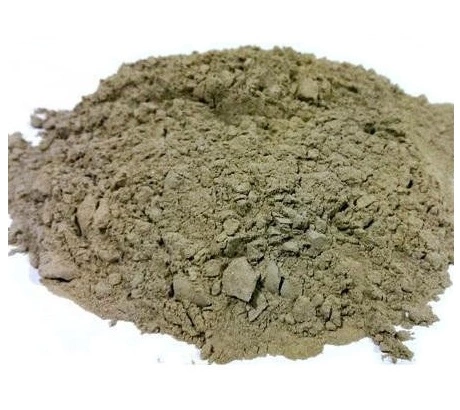
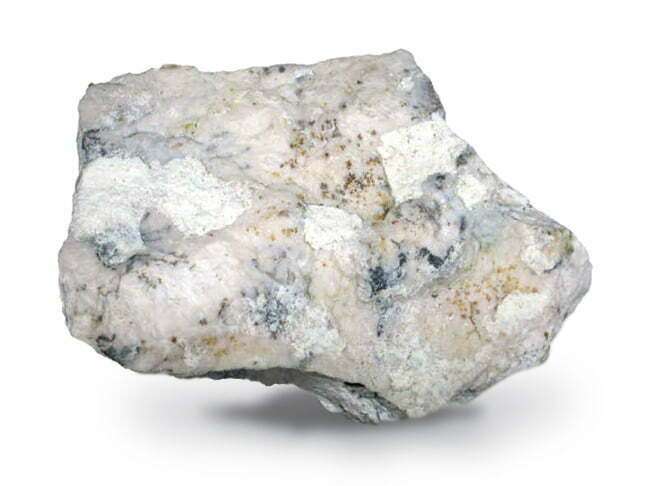
Montmorillonite (Figure 6) and illite have higher cation exchange capacities than those of chlorite and kaolinite. Consequently, shaly sandstones containing montmorillonite and illite exhibit higher conductivity, and thus lower resistivity, than shaly sandstones with chlorite and kaolinite.
While thinly laminated sequences cause logging tools to measure a type of average reading, for resistivity logging tools this averaging process is not linear but takes a complex form that is further complicated by the apparent dip of the formation with respect to the borehole orientation.
Acoustic, or Sonic, Logs
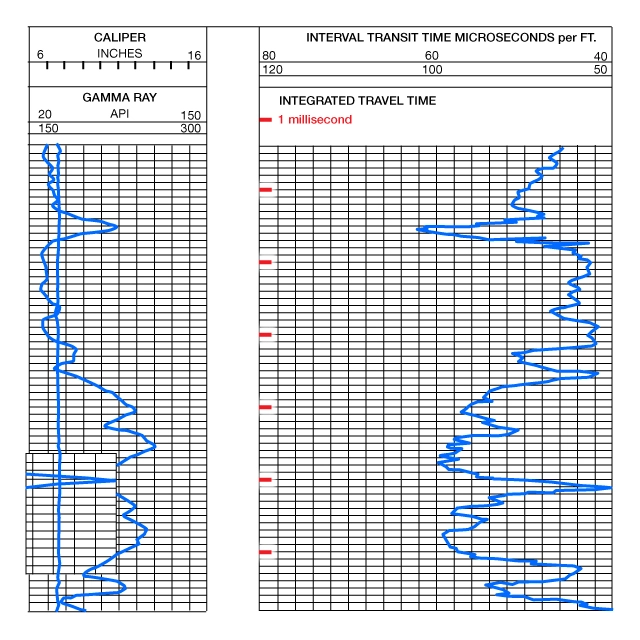
The acoustic, or sonic, logging tool records the interval transit times of a compressional sound wave (Animation 1). Clays and shales, unless extremely compacted after deep burial, are characterized by generally low acoustic velocities, thereby causing the acoustic log to record higher interval travel times (Figure 7). When the transit time of the reservoir’s matrix is subtracted from the high transit time log reading in a shaly sandstone formation, the resulting computed acoustic porosity will calculate higher than the actual porosity through that zone, unless an appropriate shale correction is first made.
Animation 2
Neutron Porosity Logs
The neutron porosity tool derives its porosity measurements from the concentration of hydrogen ions in the formation. In a clean sandstone, the hydrogen ions measured by the tool reflect the water and hydrocarbons occupying the pore spaces of the formation. This count is significantly increased, however, by the presence of clay and shale in the formation. Because hydrogen is present in the crystal structure of clays and within the irreducible water that is bound to the clay, the neutron porosity tool will register an apparent increase in porosity. In any shaly sandstone, a portion of the total porosity recorded by the neutron porosity log will consist of non-effective porosity occupied by bound water (a portion will reflect the atomic constituents of the clay minerals), with the remainder being porosity occupied by free water or hydrocarbons, both of which can be produced.
To summarize, in all shaly sandstones, the neutron porosity readings (Figure 8) will be higher than the actual formation porosity.

It has been found that chlorite and kaolinite have greater neutron porosities than montmorillonite and illite. This means that shaly sandstones containing chlorite or kaolinite will exhibit even higher porosities when compared to shaly sandstones composed predominantly of montmorillonite and illite.
Density Logs
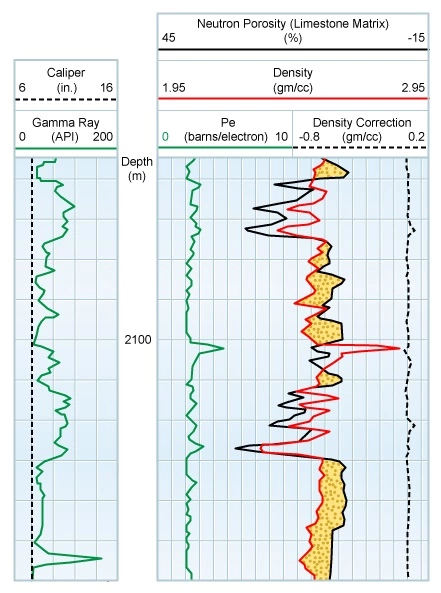
Porosity is derived from the density logging tool’s measurement of the formation’s bulk density. If the density of the clay and shale is less than that of the reservoir matrix, which is often the case, the porosity will be higher than the actual formation porosity, as the bulk density reading will be reduced by the shale content (Figure 9). Only when the clay and shale density is exactly the same as the reservoir matrix density, will the density log measure the true effective porosity.
The calculated density porosity of a shaly sandstone is affected by both montmorillonite and chlorite, but in opposing directions. The higher density of chlorite, at 2.8 gm/cc, compared to quartz at around 2.65 gm/cc, results in a lower calculated density porosity. Conversely, the lower density of montmorillonite at 2.45 gm/cc compared to quartz results in a higher calculated density porosity.
