Specialist Crossplots
Introduction
Crossplotting data from just two porosity well logs at any one time does not make full, simultaneous use of all the porosity data available when three porosity logs—density, neutron porosity and sonic or acoustic logs—have all been acquired. If a three-dimensional model could be built with the X, Y and Z axes corresponding to the neutron porosity, density and sonic log responses, then identifiable minerals would occupy unique points in the three-dimensional space. Complex, mixed lithology intervals, in particular, could thereby be more easily interpreted.
Specialist Crossplot Examples
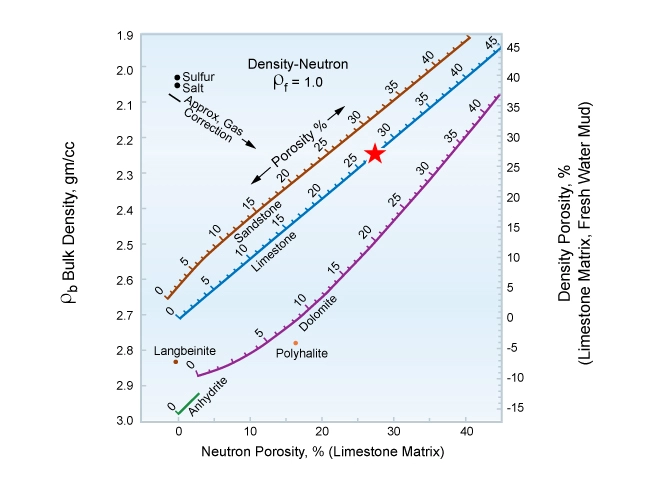
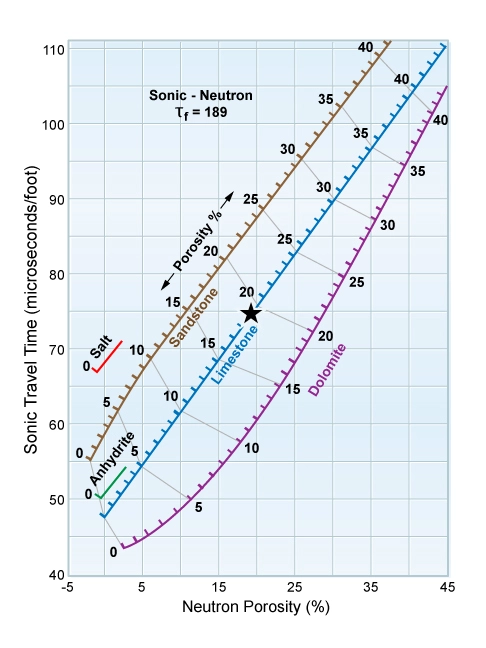
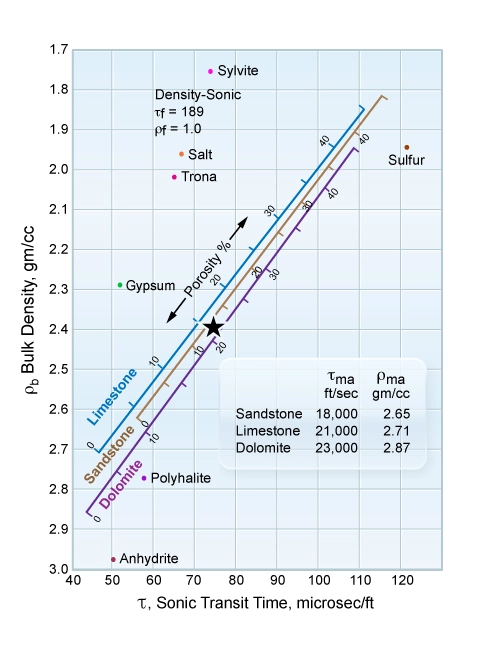
As an example, a 50% mixture of sandstone and dolomite would appear to be a limestone on both the neutron porosity versus density (Figure 1) and the neutron porosity versus sonic (Figure 2) crossplots. By contrast, the density versus sonic crossplot (Figure 3) would be more lithologically indicative for the formation.
M-N Plot
A number of techniques have been developed to resolve the problem of reducing three well log porosity readings to a two-dimensional crossplot. One of the early methods, still widely used, is the M-N plot. This crossplot requires that two parameters, M and N, be defined as:
![]()
![]()
Where ρf is fluid density. Note that ϕN needs to be in fractional units and that ϕN fluid is assumed to be 1.
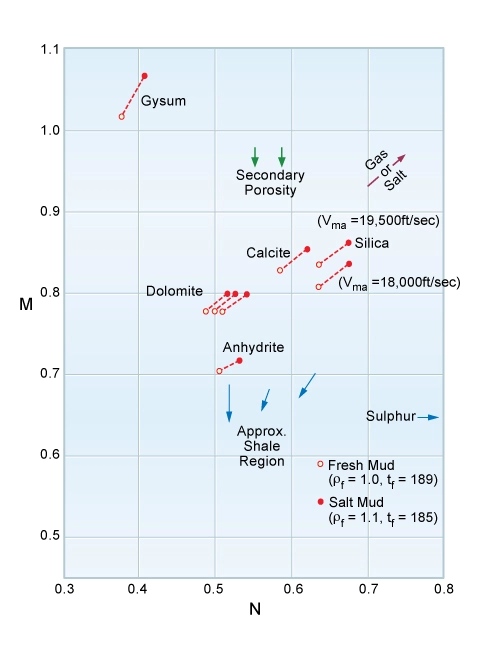
These two definitions are algebraic methods for finding the slope of a line that passes through a plotted point and the theoretical 100% porosity point. Since any pure conventional resource reservoir rock will plot on a line on the crossplots, and the slope of this line is substantially constant, that slope is a characteristic of a specific rock type. Having defined M and N and determined them for given depths logged in the well, the M and N pairs can be plotted on an M-N plot template (Figure 4).
However, the M-N plot has three relatively minor shortcomings:
- It is not completely porosity independent for dolomite since the neutron porosity response is not exactly linear.
- Each plotted data point depends somewhat on ρf, the fluid density.
- The actual values of M and N for common minerals and reservoir rocks have no particular significance in themselves.
The M-N plot is still regularly used by petrophysicists. Figure 4 shows anhydrite and its hydrated form of gypsum identified from plotted M-N data.
However, some log analysts rely more on another crossplot technique that accomplishes the same end result of lithology identification but rather more elegantly, the MID plot.
The Matrix Identification Plot (MID)
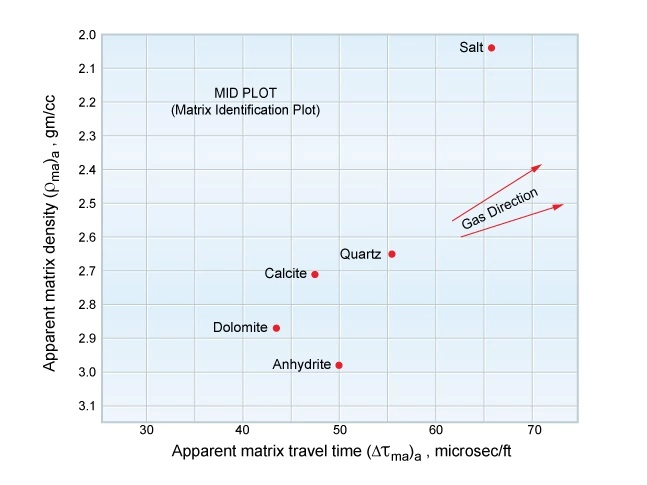
The matrix identification plot (MID) incorporates, in a single plot, all the three main porosity logs: density, neutron porosity and sonic. Its main advantages over the M-N plot include its independence from the formation porosity and the drilling mud type, and the benefit that it uses meaningful parameters directly related to rock properties that are more easily remembered.
The neutron porosity and density logs are combined to define the apparent matrix density, (ρma)a. The neutron porosity and sonic logs are combined to define the apparent matrix travel time, (Δtma)a. These two parameters are then crossplotted to determine the formation lithology.
The value of (ρma)a is computed from the equations:
![]()
![]()
and likewise,
![]()
In practical log evaluation, these values are automatically computed within petrophysical analysis programs, or can be found from published charts.
MID Plots
Figure 5 defines (ρma)a for any ρb, ϕN pair.
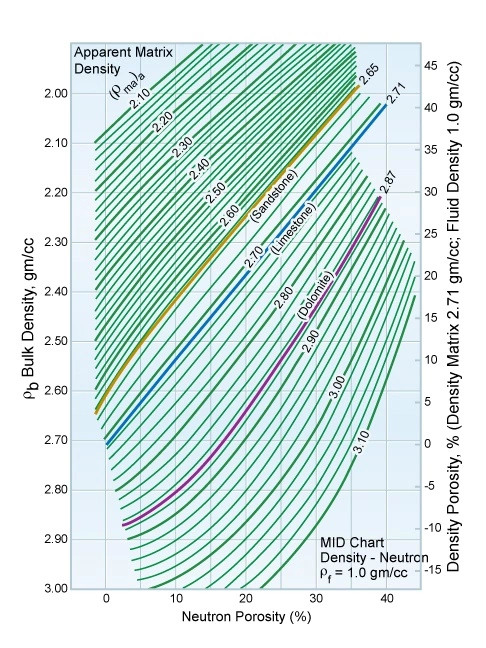
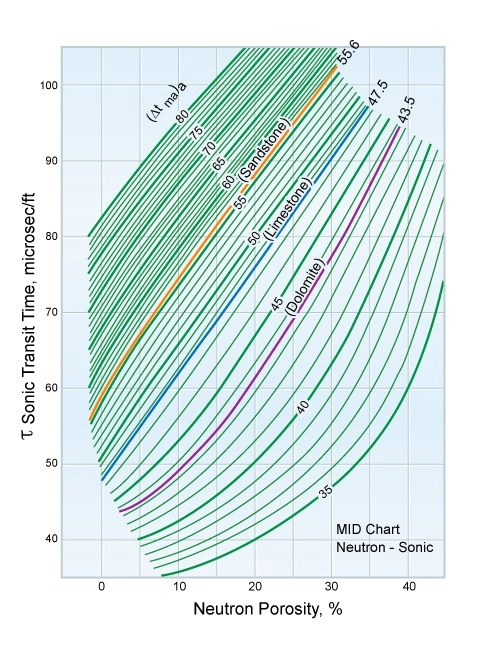
Figure 6 defines (Δtma)a for any Δt, ϕN pair.
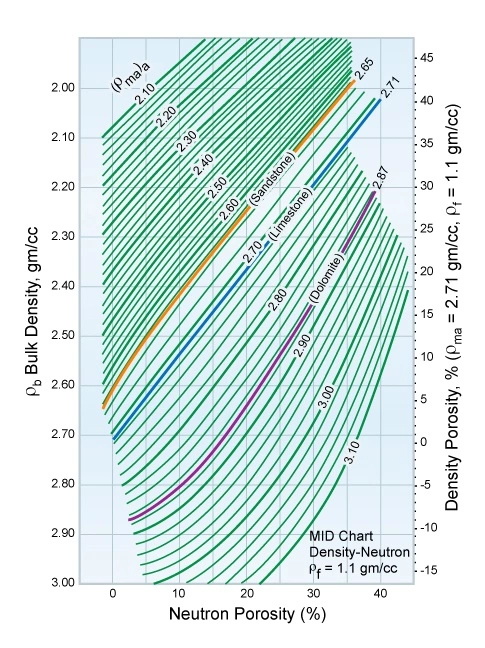
The computer algorithms shown in Figure 7 should be used in place of those in Figure 5 when ρf = 1.1 (salt water base mud filtrate).
Once (ρma)a and (Δta)a have been determined, they are crossplotted on the MID plot chart shown in Figure 8.
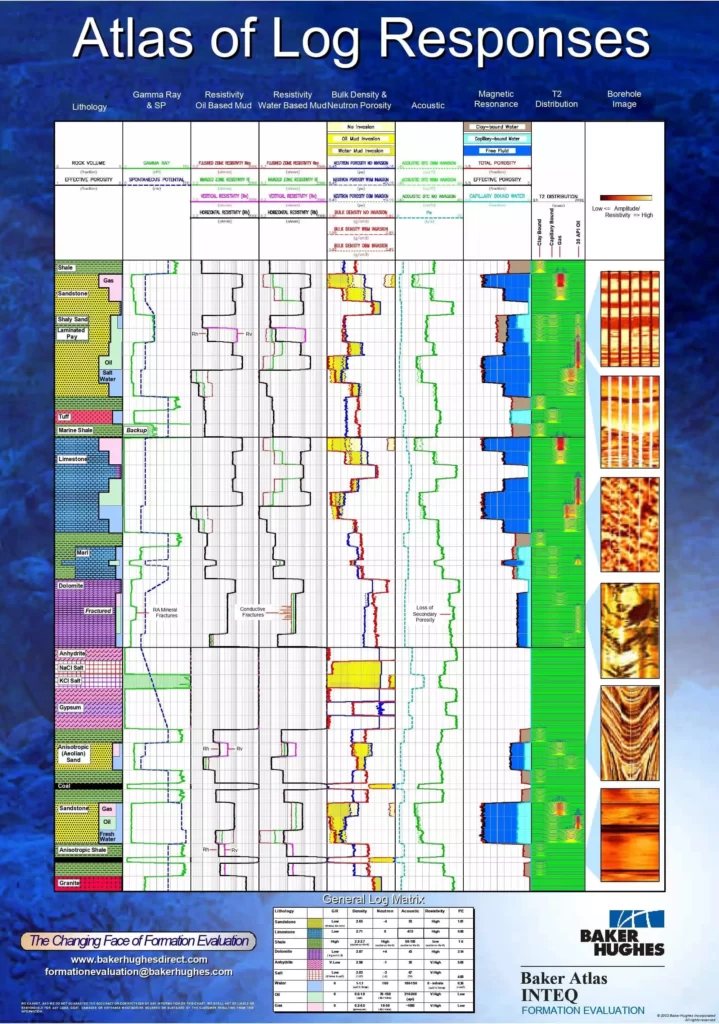
When using either the MID plot or the M-N plot, it is useful to have a reference chart available which summarizes the values of ρma and Δtma, and log responses for common minerals and reservoir rocks. The Baker Hughes Atlas of Log Responses is one such reference Figure 9.
 Petro Shine The Place for Oil and Gas Professionals.


