Learning Objectives
After completing this course “Lithology Identification From Well Logs“, you will be able to:
- Use spontaneous potential (SP) logs to help determine the formation lithologies.
- Analyze natural and spectral gamma ray well logs to establish the lithologies.
- Derive the formation lithologies from porosity logs.
- Generate a range of specialist crossplots to facilitate lithology determination.
- Interpret multi-mineral analyses to establish the formation lithologies.
Overview
Well logs are an invaluable source of information for geologists and petroleum engineers, providing critical insights into subsurface formations. One of the key tasks in analyzing well logs is lithology identification, which involves determining the rock types present in a wellbore based on the recorded log measurements.
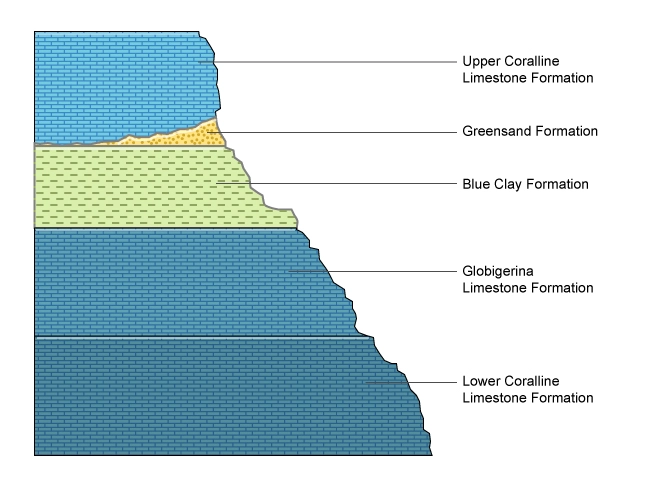
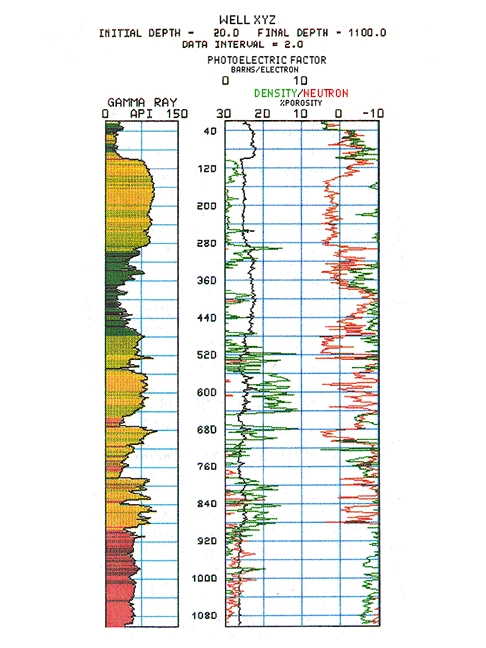
Well logs, whether they are acquired by logging while drilling (LWD) or wireline operations, can be integrated with the other subsurface data acquired to interpret the lithologies (Figure 1) of the different formations encountered when drilling a well.
This article will explore the process of lithology identification from well logs, discussing the techniques, challenges, and benefits associated with this important geological analysis.
Introduction
Lithology identification from well logs is a fundamental task in the field of petroleum geology. It involves interpreting the recorded log data to determine the types of rocks encountered while drilling a well. By understanding the lithology, geoscientists can assess reservoir characteristics, such as porosity, permeability, and fluid saturation, which are crucial for reservoir evaluation and hydrocarbon exploration.
Well Logs: A Brief Overview
Well logs are measurements taken during drilling or after completion of a well. These measurements provide information about the properties of rocks, such as their electrical, acoustic, or radioactive characteristics. Common types of well logs include gamma ray, resistivity, sonic, density, and neutron logs, among others. Each log provides specific data that can aid in lithology identification.
Importance of Lithology Identification
Accurate lithology identification is vital for various reasons. Firstly, it helps in understanding the geological history of the formation and the depositional environment. This information is crucial for predicting the presence of hydrocarbons and estimating the reservoir’s production potential. Additionally, lithology identification aids in wellbore stability analysis, drilling optimization, and formation evaluation, enabling engineers to make informed decisions during the drilling and production phases.
Well Logs for Interpreting Lithologies, Techniques for Lithology Identification
Various well log measurements and techniques are employed for lithology identification. Here are some commonly used ones:
Spontaneous Potential (SP) Log
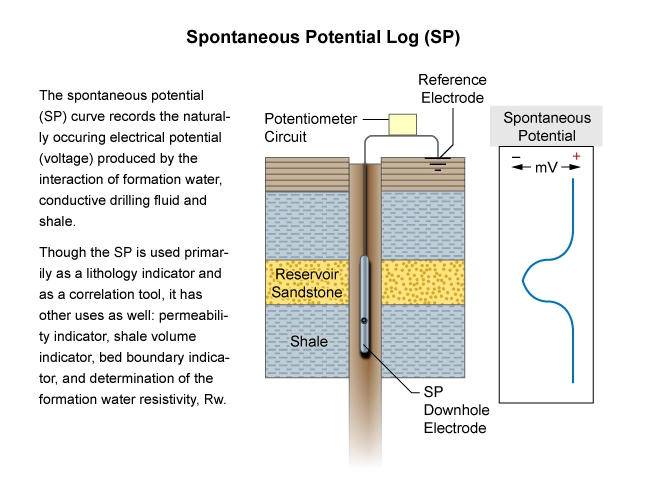
Spontaneous potential (SP) log (Figure 2)
Spectral Gamma Ray Log
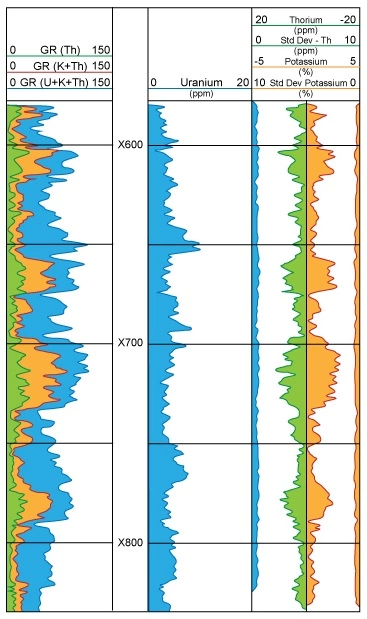
Spectral natural gamma ray log (Figure 3)
Natural Gamma Ray Log
Natural gamma ray log (Figure 4)
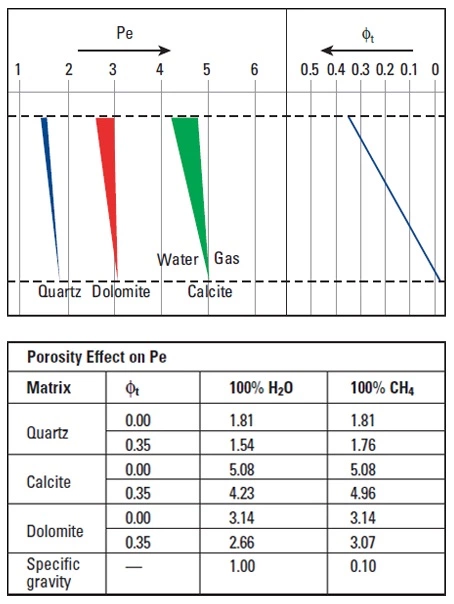
Density Log: Photoelectric Factor
Density log: photoelectric factor, ρe (Figure 5):
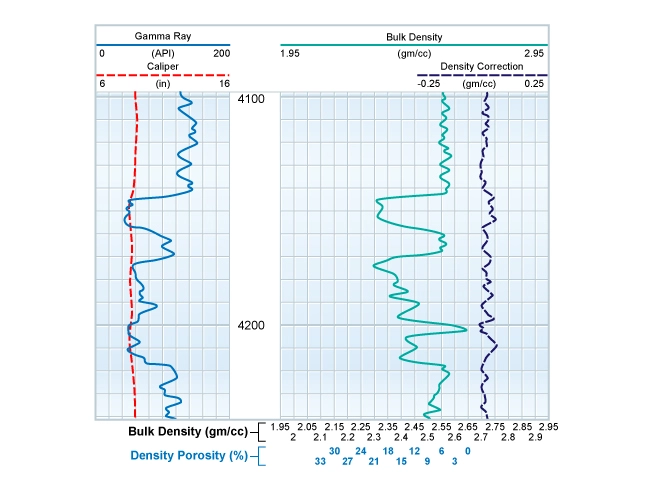
Bulk Density
Bulk density, ϕb (Figure 6):
Neutron Porosity Log
Neutron porosity log: neutron porosity, ϕN (Figure 7):
Sonic, or Acoustic, Log
Sonic, or acoustic, log: transit time, Δt (Figure 8):
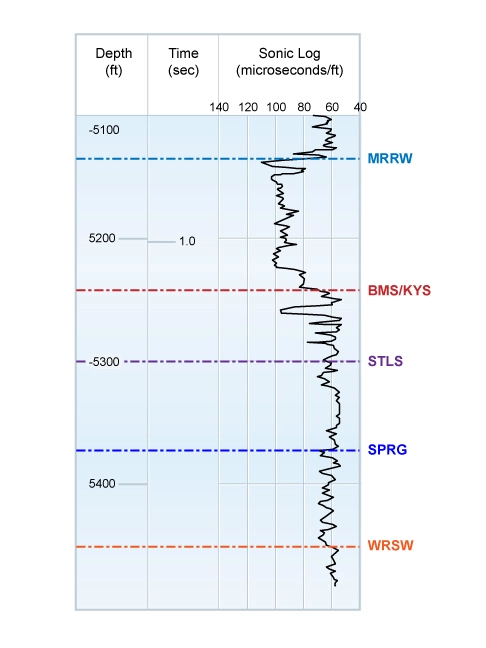
With the exception of the photoelectric factor measurement, ρe, no single porosity tool measurement gives, by itself, a direct indication of the formation lithology. All other well logs require some interpretation, or calibration, prior to their use as lithology indicators.
Useful lithology information can be derived with combinations of different porosity tool measurements.
The most useful combinations are:
Combination Logs for Interpreting Lithologies
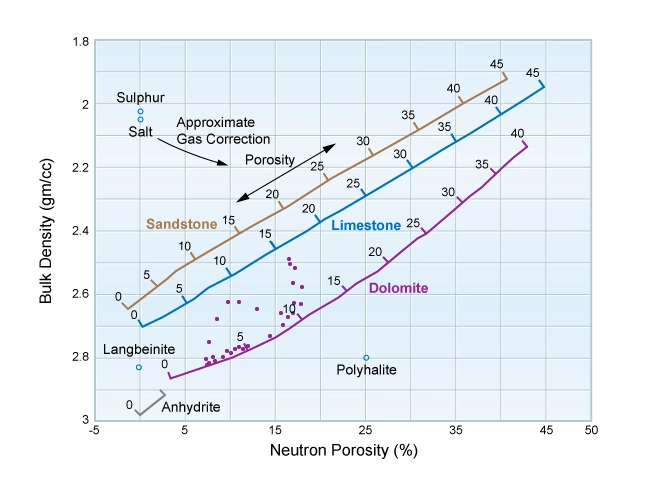
Density-Neutron Crossplot
Density-neutron crossplot, ρb versus ϕN (Figure 9):
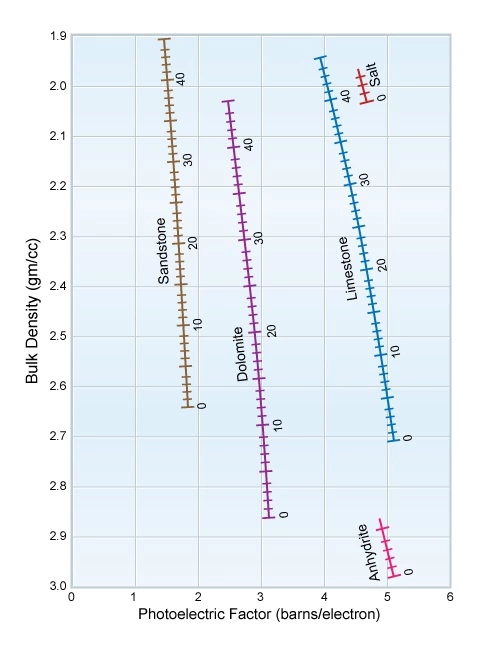
Photoelectric Factor Versus Bulk Density Crossplot
Photoelectric factor versus bulk density crossplot, ρe versus Δt (Figure 10):
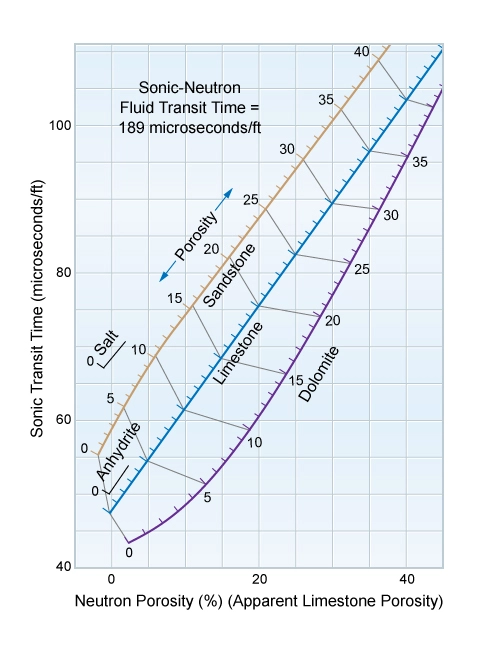
Sonic Versus Neutron Porosity Crossplot
Sonic versus neutron porosity crossplot (Figure 11), Δt versus ϕN.
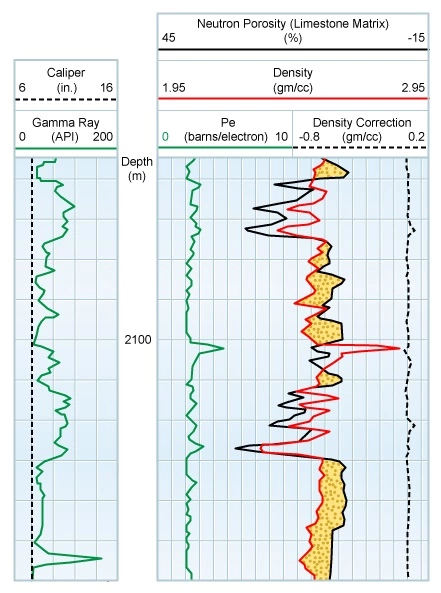
Photoelectric Factor From Density Log in Conjunction With Density and Neutron Porosity
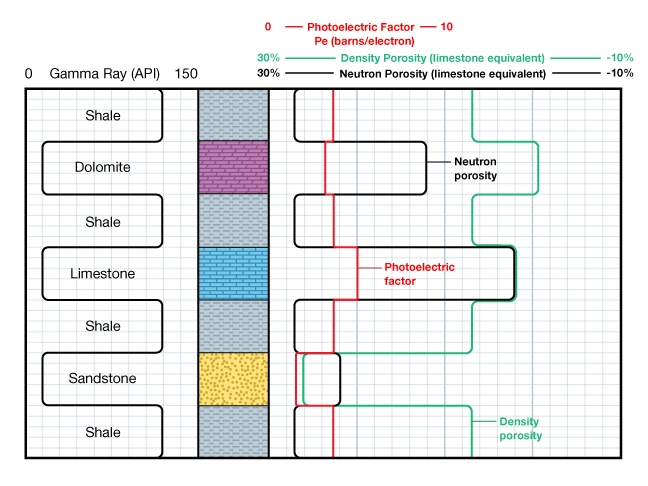
Photoelectric factor from the density log used in conjunction with density and neutron porosity (Figure 12):
M-N Crossplot
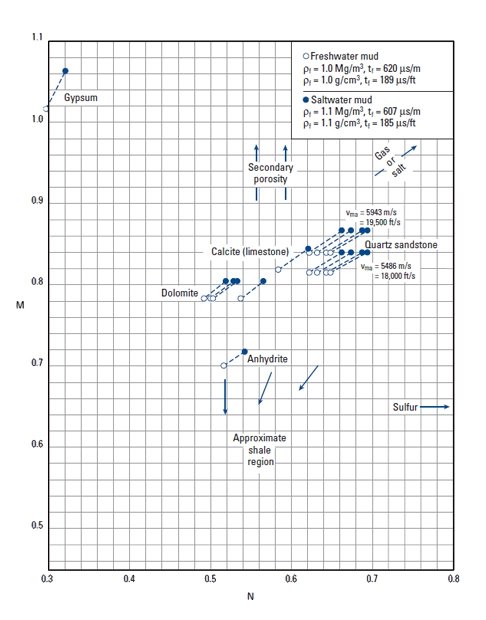
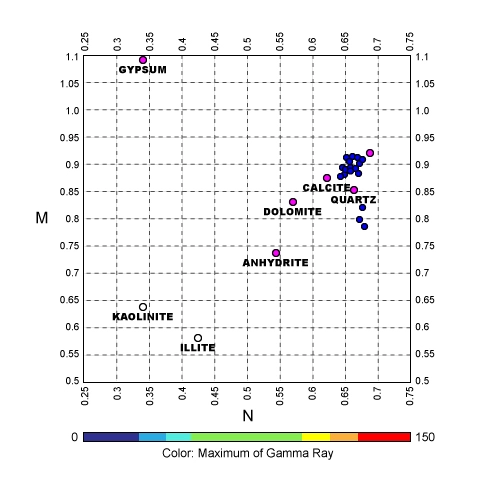
The M-N crossplot (Figure 13 and Figure 14), where the M and N values plotted on the crossplot with M (y-axis) and N (x-axis) axes are the slopes of the individual lithology lines on the sonic-density and density-neutron crossplots, respectively.
The Matrix Identification Crossplot
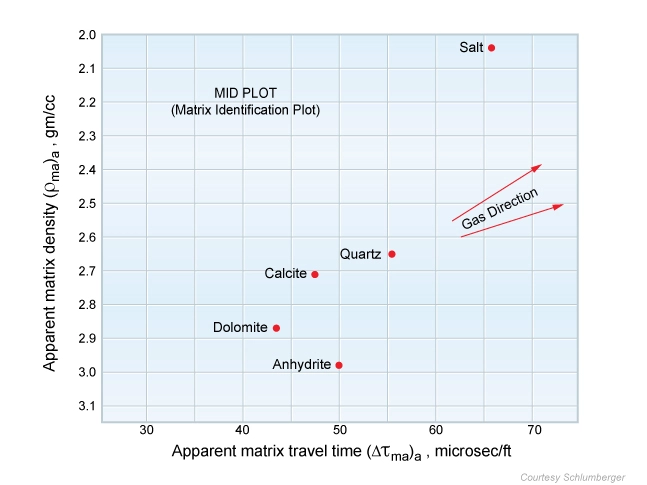
The matrix identification crossplot (MID plot) (Figure 15), which is a crossplot of the apparent matrix density versus the apparent matrix travel time:
Photoelectric Factor ρe and Spectral Gamma Ray Playbacks
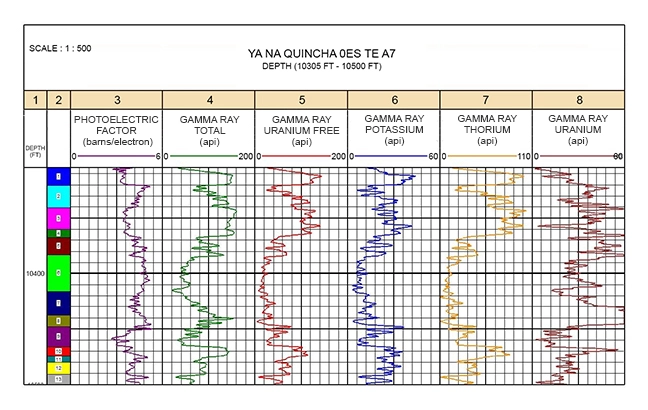
Photoelectric factor ρe and spectral gamma ray measurements of potassium, uranium and thorium (K, U, and Th) (Figure 16):
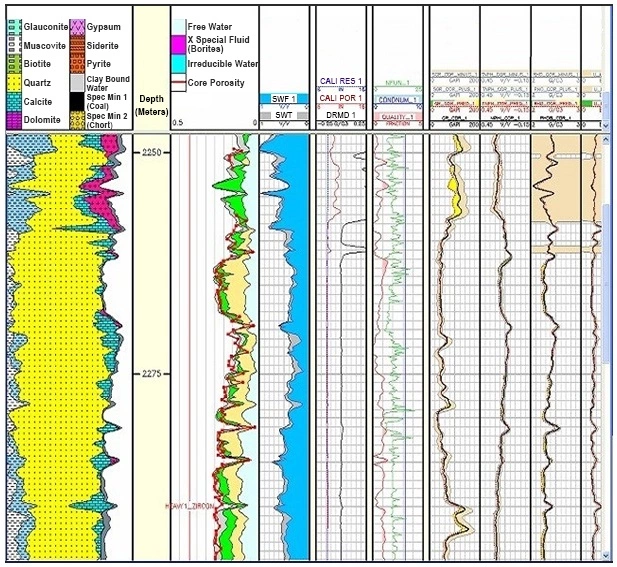
Some logging service companies offer proprietary multi-mineral elemental analysis well log interpretation techniques for the log data which they have acquired. These analyses (Figure 17) compute the most probable formation lithology, mineralogy and pore fluid volumes, often using a multi-log, least squares inversion technique. Such petrophysical techniques are most applicable in reservoirs of mixed lithologies and mineralogies, and in dual porosity reservoir systems. The correct identification of all the minerals likely to be encountered in the well is absolutely critical to constraining the number of possible solutions and so generate a plausible log interpretation.
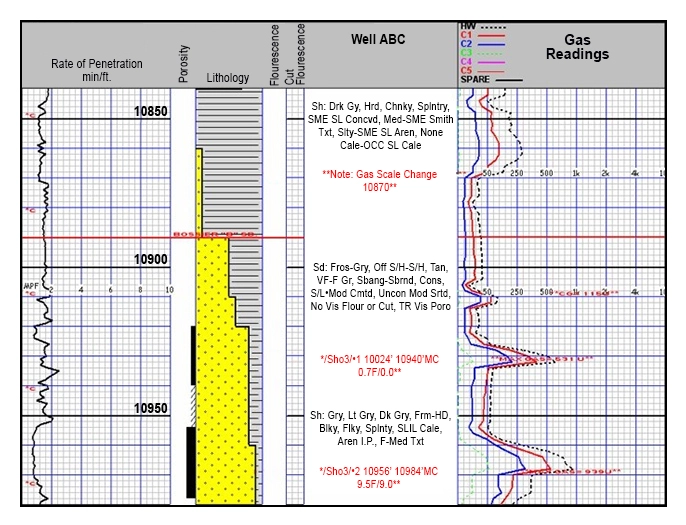
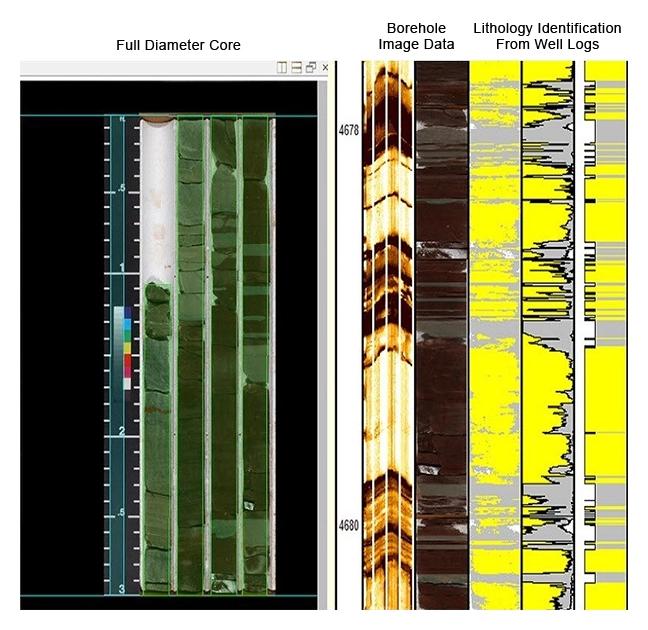
It is also possible to play back digital porosity log data in different formats to give a visual indication of the rock type and lithology, in combination with mud logs (Figure 18) and any available full diameter or sidewall core data (Figure 19). In sections of mixed lithology and different formations within an open wellbore section, it is essential to break the interval logged into several different, coherent zones (zoning), and to identify the relevant rock type(s) for each zone to correctly pick the parameters needed for the shale volume, porosity and water saturation calculations.
 Petro Shine The Place for Oil and Gas Professionals.


