Related Articles

Fracture Geometry
In deciding whether to place a propped fracture or an acid fracture in a a carbonate formulation, we must be guided by the treatment costs and their expected post-treatment performances. For both types of treatments, there are optimal fracture lengths based on the Net Present Value (NPV) of the fracture treatment (Economides et. al., 1994). In general, acid treatments results in shorter fractures than propped treatments, and thus would more likely be appropriate for higher-permeability formations.
Theoretically, a vertical fracture extends an equal distance from the wellbore in opposite directions (Figure 1, Fracture geometry).
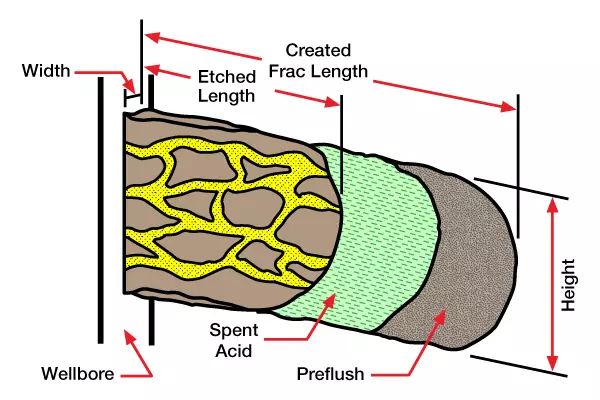
Fracture geometry is defined as fracture length in one wing of the fracture times the height and width of that wing. Factors that affect fracture geometry are:
- volume of injected fluid
- fluid loss
- viscosity of injected fluids
- injection rate
- rock properties
- formation fluid properties
The first four of these factors can be controlled. Volume is restricted only by economic factors; injection rate can be in-creased by using friction reducers, more hydraulic horsepower, larger tubular goods, or a combination of these. More information about these controllable variables follows.
Fluid Loss: It is much more difficult to control this critical factor with acid solutions than nonacid solutions, because the acid reacts with the formation to continually enlarge pore sizes. Fluid loss not only affects fracture geometry, it also influences acid penetration distance through fluid leakoff velocity. Table 1 (below) presents data illustrating the importance of fluid loss control. In this example, the formation had an average permeability of 1 md and 15% porosity. In each case, the only variable was the fluid loss properties of the acidizing fluid.
| Fluid Loss Additive concentration | Ceff ftmin  | H,ft | W, in | L, ft | Rate,BPM | % Fluid eff |
|---|---|---|---|---|---|---|
| None | 0.005 | 75 | 0.036 | 136 | 15 | 4.6 |
| 50 lb/100 gal | 0.001 | 75 | 0.082 | 501 | 15 | 38.4 |
| 100 lb/100 gal | 0.0001 | 75 | 0.120 | 811 | 15 | 91.0 |
Ceff = effective fracture conductivity
H = fracture height
W = average fracture width
L = fracture length
% Fluid efficiency = percentage of fluid retained in fracture during treatment
Viscosity: Viscosity affects the reaction rate of acid on carbonate rock because it influences the treatment fluid’s capacity for turbulence, and thus the rate of contact between the hydrogen ions and the rock surface. The higher the viscosity of the acid, the lower its capacity for turbulent flow, and the lower the reaction rate.
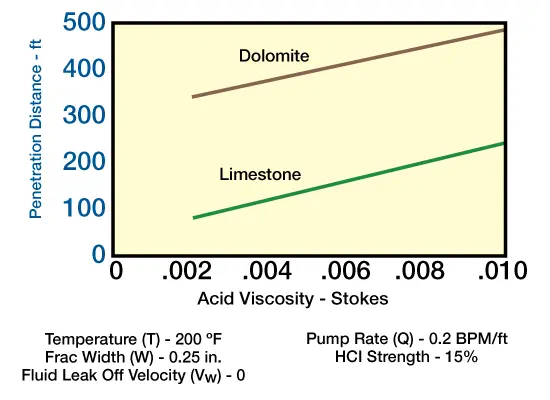
Viscosity may also be the most important factor affecting the penetrating distance of live acid in carbonate rock. High viscosity means low turbulence, which in turn means low acid-spending rate and deeper penetration. This phenomenon is shown graphically in Figure 2 (Acid penetration distance vs. acid viscosity). (The term used to describe viscosity in this figure is the “stoke,” which is equivalent to  ) Doubling the viscosity provides a significant increase in the penetration distance of live acid.
Another phenomenon not shown in this curve is the relation of increased viscosity to fracture width. As viscosity increases, the fracture width at a given pump rate also increases ( Table 2, below). Although larger volumes of acid are regard for this purpose, even greater penetration distance can be achieved.
| Viscosity, cp | Fracture width, in |
|---|---|
| 1 | 0.038 |
| 10 | 0.068 |
| 100 | 0.120 |
| 1000 | 0.214 |
Injection Rate = 10 BPM
Fracture Length = 100 ft
Young’s Modulus = 10⋅106 psi
Injection Rate: Generally speaking, the higher the injection rate, the greater the fluid turbulence, and the greater the rate of contact between the hydrogen ions and the rock surface — in other words, the greater the acid spending rate. Spending rate is governed by these factors in combination with hydrogen ion concentration. Increased hydrogen ion concentration and turbulence work together to increase acid spending rate and decrease penetration distance.
Increased injection rate can increase penetration distance under certain circumstances. All other things remaining constant, the faster acid flows down a fracture, the farther it will travel before it spends (unless it goes into turbulent flow). This is because contact time between the acid and the formation is insufficient to allow complete reaction between the acid and the formation.
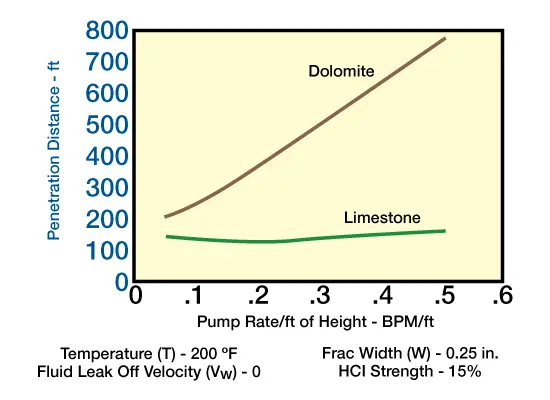
Figure 3 (Acid penetration distance vs. pump rate) shows both phenomena occurring. The curve for limestone shows a decrease in penetration distance as the acid goes into turbulence. Then an increase can be seen as the acid travels farther in a given period of time. On the dolomite curve, the distance traveled is more important than the mixing rate because the surface reaction rate is slower for dolomite than for limestone.
Higher injection rates also increase the fracture width, provide greater cooling effects, and improve fluid efficiency. These effects are not shown on this curve, but all tend to increase penetration distance.