Related Articles


Measuring Fluid Saturations
Retort Distillation Method
The retort distillation method for determining fluid saturation in core material uses the same apparatus (Figure 1) as is used in the summation-of-fluids estimation of porosity. (In a core analysis laboratory, a retort is a glassware device used for distillation.)
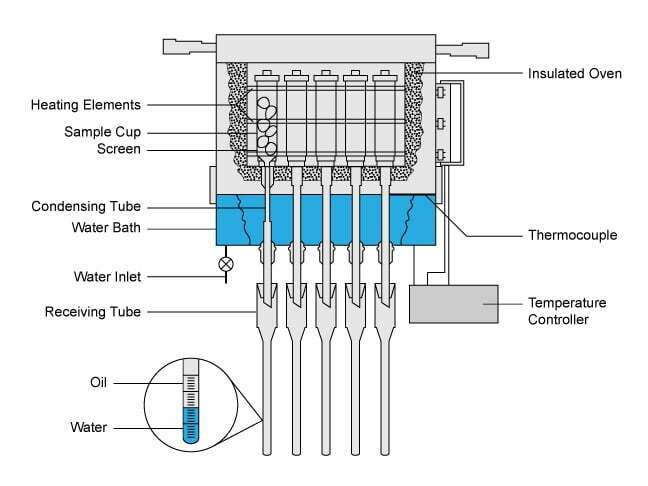
In this procedure, a fresh core sample taken from the center of the full diameter core is weighed and its bulk volume measured or calculated. It is then placed in a cylindrical metal holder with a screw cap on the top and a hollow stem projecting from the bottom. The top is sealed and the sample holder is placed in a retort oven. A temperature controller raises the temperature of the core sample to a selected level, at which point the water within the sample is vaporized, condensed and recovered. The temperature is then increased to 1200ºF (650ºC) to vaporize and distill oil from the sample.
The apparatus in Figure 2 is referred to as a downdraft retort because vaporized fluids build up pressure in the sample holder and then move vertically downward through the hollow stem. They are subsequently condensed and measured in a calibrated receiving tube. The retort oil correction curve is used to correct the volume measured in the receiving tube to the actual volume that was present in the core sample.
The retort distillation procedure is normally restricted to small core samples that are destroyed during the process; it is not generally used for full diameter cores. When a full diameter core is analyzed in a full diameter retort, a vacuum is pulled on the system, and a temperature not greater than 450ºF (232ºC) is normally used. The lower temperature is selected to avoid damaging the rock sample, which may subsequently be used to measure the rock’s permeability. If the saturating oil has an API gravity of 30º or less, some residual oil is left in the full diameter core after retorting. This volume can be estimated by using additional test information from high temperature retorting of adjacent rock samples, or by monitoring the volume of oil recovered during retorting and applying a correction factor.
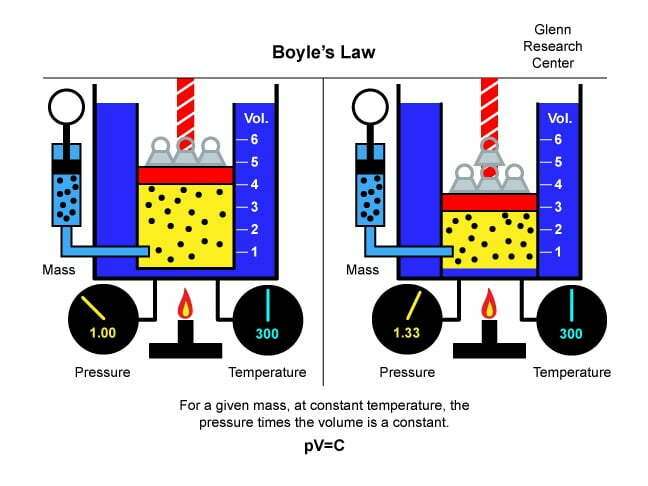
The correction factor for low API gravity oils can be substantial. If helium is subsequently used to estimate the porosity of the sample, and the appropriate compensation is not made for the volume occupied by residual oil, the Boyle’s Law (Figure 3) porosity value will be erroneously low. This full diameter retort procedure for estimating residual saturations is used in a limited number of situations and under those conditions where the speed of analysis is paramount. It is not the preferred technique for analysis.
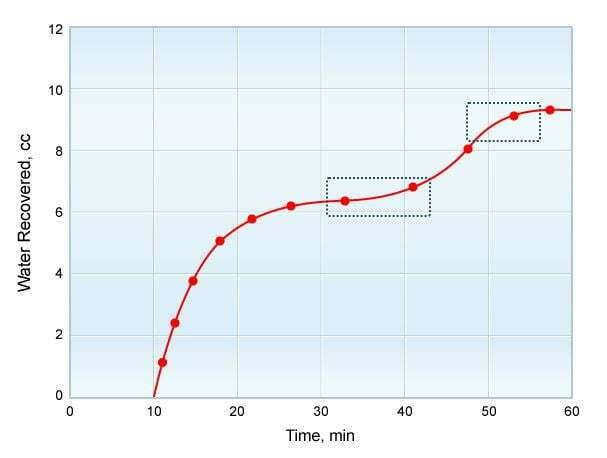
During the retort distillation procedure, water and oil content are measured concurrently. When the volume of the collected water is measured during the temperature rise to 1,200ºF (650ºC), a distinction must be made between pore water held by capillary forces (the value sought) and that which is the result of mineral decomposition. One approach to distinguishing between the two is to plot the water recovered against the elapsed time of retorting.
The advantages of the retort distillation method are that it is a rapid method (taking approximately one hour) of adequate accuracy, and involves the direct measurement of the volumes of both oil and water recovered. The disadvantage is that it requires very high temperatures of 1,200ºF (650ºC), which may cause the oil to crack or turn to coke. (Cracking is the breaking of long chain hydrocarbons into smaller chain hydrocarbons, which may not be re-condensed; and coke is impure carbon residue formed from oil.) The high temperature may vaporize the water of crystallization in clays, and this can be determined by a graphical approach (Figure 4).
Dean-Stark Apparatus
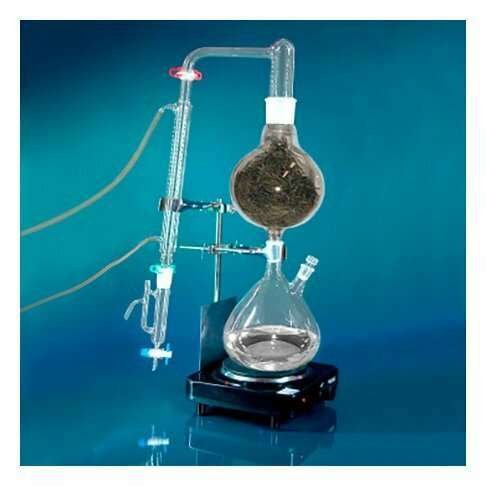
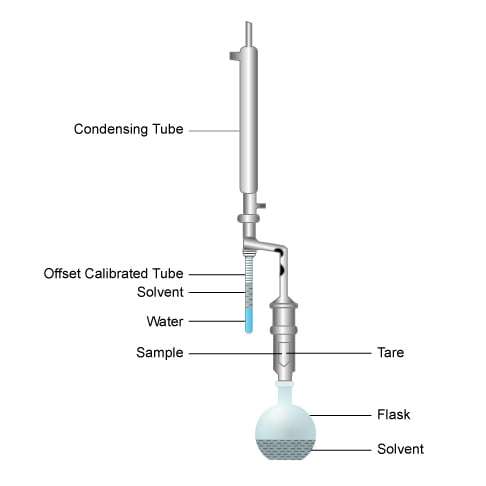
The Dean-Stark apparatus is laboratory glassware used to collect water from a reactor (Figure 5). It is used in combination with a reflux condenser and a batch reactor for the continuous removal of the water that is produced during a chemical reaction performed at reflux temperature. It was invented by E. W. Dean and D. D. Stark in 1920 for the determination of the water content in petroleum.
With the Dean-Stark method of measuring residual fluid saturations we can obtain the residual saturations, porosity and permeability of a cylindrical sample from the same piece of rock. This assures compatibility of the data for example, a plot comparing permeability with porosity is valid. The measuring device provides a direct determination of the water content of the core sample.
In the Dean-Stark process, a fresh sample (normally a 1.5 inch diameter core plug cut from a full diameter core) from the center of a full diameter core is weighed and then subjected to an extraction of its fluids by boiling solvent. The oil content is calculated from a weight difference calculation, and therefore, it is important that no sand grains are lost from the core during the analysis, as this would result in erroneously high calculated residual oil saturation. Rock grain loss is easily controlled by maintaining the sample within a tare throughout the Dean-Stark analysis, and good quality work uses this technique. (The tare of a container is its weight when it’s empty, which is required when you cannot weigh a sample without putting it into a container.)
The principle of operation is straightforward. When the core sample is weighed, the resulting measurement will consist of the weight of the sand grains plus the oil and water present in the pore spaces. The sample is then placed within a tare in the apparatus and suspended above a flask containing a solvent such as toluene, or a mixture of acetone and chloroform. Whatever the solvent, it must have a boiling point higher than water and be both immiscible with, and lighter than, water.
Next, heat is applied to the solvent, causing it to boil (toluene boils at approximately 240ºF [115ºC]). The hot solvent vapor rises, surrounds the sample and moves up into the condensing tube, where it is cooled and condenses. The condensate falls to the bottom of the offset calibrated tube. The tube slowly fills until the liquid reaches the spill point, whereupon solvent condensate runs down the connecting side arm and drips onto the sample, which contains residual fluids. The dripping solvent mixes with oil from the sample, and both the solvent and oil are returned to the solvent flask.
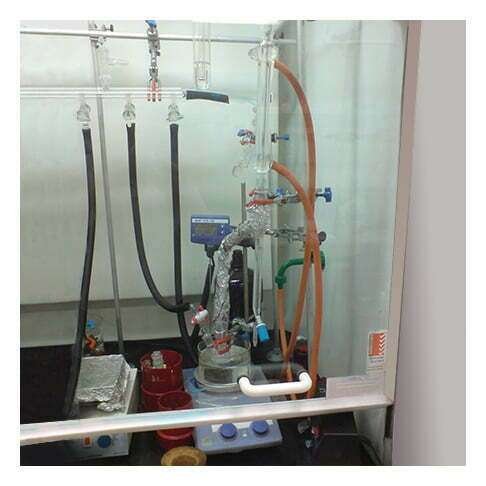
The process continues until the sample’s temperature is raised to the boiling point of water. When it does, the water vaporizes, rises in the condensing tube until it condenses and falls back into the calibrated tube. Because it is heavier than the solvent, it collects at the bottom of the tube, where its volume can be measured. When successive readings indicate that no additional water recovery has occurred, we know that all the water has been removed from the sample and the water volume is recorded for further calculations. The rock sample may be retained in the Dean-Stark apparatus (Figure 6) until all the oil is removed, or it may be moved to another apparatus for subsequent cleaning and drying.
After all the water and oil have been removed from the core sample, it is dried and again weighed. The difference between the original and final weight is equal to the weight of oil and water originally in the sample. Because the water collected in the calibrated tube is distilled water with a known density of 1.0 g/cm3 and the volume of water recovered is known, the weight of oil in the sample can be calculated. Knowing the density of the oil allows its volume to be calculated. When this information is subsequently combined with the estimated porosity of the clean, dry sample, the volumes of residual oil and water can be converted to percentage pore space.
Salts, originally dissolved in the residual water, remain in the core sample when water is vaporized from the core. The water volume collected in the calibrated tube contains no dissolved ions; consequently, the volume occupied by the residual water in the pore space is greater than that read. The difference is small and is typically ignored in conventional core analysis, but is measured, when appropriate, in the special core analysis tests.
The advantage of the Dean-Stark method is that it accurately determines the water saturation, while being non-destructive to the core samples. For a small incremental cost the determination of water saturation by solvent extraction can be made part of the core sample cleaning process. The disadvantages are that it is a slow process, which can take several days, and that the oil volume is not directly measured, but remains in the solvent. The Dean-Stark method is usually the favored method for determining the fluid saturation of core, primarily because fluid saturations, permeability and porosity are measured on the same sample.
Accuracy of Measurements
Both the retort distillation and the Dean-Stark analysis are capable of estimating the residual saturation values to within ± 5% of the actual value. In a study made by Rathmell (1973), where high temperature retort oil saturation measurements were compared with gravimetric measurements, the average residual oil saturation agreed to within ± 1.4% pore volume. The average residual oil saturation in these cores was approximately 45% pore space, and the scatter of the data was ± 6.1% pore volume. API RP 40 reports the accuracy of the retort distillation technique to be ± 5% of the true value.
Core Plug Acquisition Best Practice Recommendations, Including Use of Water Base and Oil Base Muds
The authenticity of the fluid saturation data has often been questionable because of invasion by drilling and coring mud filtrate. Ringen et al. (2001) note that improvements in coring, doping of mud and analysis are making saturation values derived from cores more valuable.
With water base muds, contamination from mud filtrate can be caused by:
- Spurt loss, as water from the mud invades the core ahead of the bit
- Static invasion, as mud invasion continues in the core barrel
- Displacement of mobile fluids in the core as the pressure declines and fluids expand as the core barrel is raised to the surface
- Additional redistribution within, and evaporation of fluids from, the core with handling at the surface
To some extent, such mud filtrate invasion has been reduced by using new bits, mud designs with low overbalance, coring parameters with low pump rate and high ROP (rate of penetration), gel core, slow core barrel tripping to limit the effects of gas expansion and, ideally, pressurized core barrels. However, some filtrate invasion is unavoidable, and a tracer should be used to correct for the invasion, such as tritium (preferred), deuterium oxide or chemical salts (least desirable), in the drilling mud and drilling samples at the wellsite when using water base muds. Core plugs should be drilled vertically, without using water, from the center of the core to avoid the outer zone of invasion, then sealed and transported to the laboratory.
Figure 7 is a cross plot of mud filtrate invasion against permeability for a number of wells, with some plugs cut from cores at the wellsite and others drilled in the laboratory several days later. There is a general trend of increasing filtrate invasion with increasing permeability. More significantly, the plugs drilled at the rig site show considerably less filtrate invasion overall, and very little, if any, increased invasion with increased permeability.
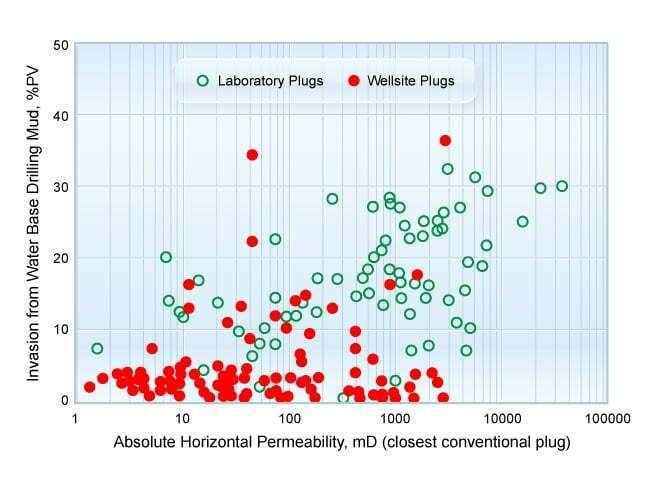
The conclusion is that mud filtrate invading the core diffuses towards the center of the core over time. The plugs for Sw determination by the Dean-Stark method should preferably be drilled at the wellsite immediately after core retrieval whenever water base muds are used.
When successive full diameter cores are cut in a well, the bottom of the well will experience some significant mud filtrate invasion during tripping of the core barrel before the new core cutting starts. The top section of each core will, therefore, tend to have higher mud filtrate invasion. For an improved representation of reservoir conditions, the first plug sample of each new core should be cut some distance (at least one foot/0.3 m) away from the top of the core.
Oil base muds can contain 10% to 35% water as an emulsion. In most oil base mud, there is no change in the water saturation in the center of full diameter cores for a wide range of reservoir properties and lithologies. Plugs can, therefore, be drilled in the laboratory with satisfactory results when oil base mud is used.
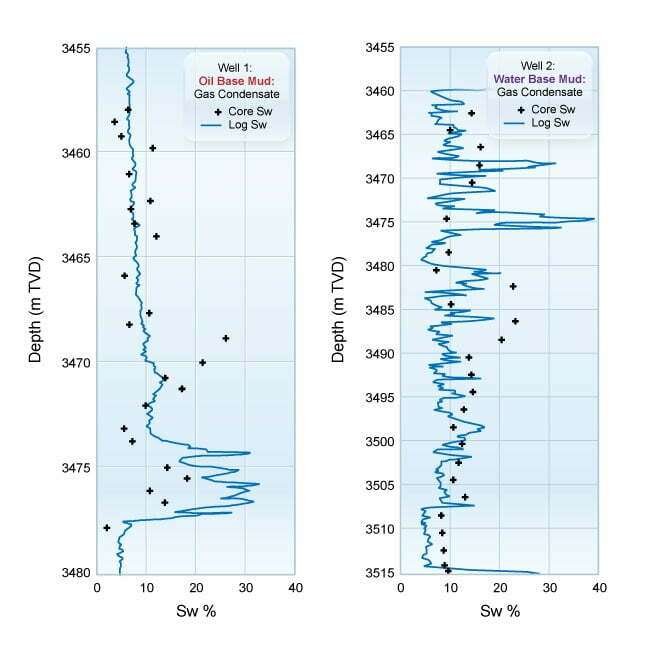
If these best practices for acquiring cores and deriving the fluid saturations in the laboratory are followed, the log-derived and core-derived fluid saturations can complement each other to establish quality input data for hydrocarbon in place studies and field development planning. Similar quality control measures should be taken for the log-derived fluid saturations. The appropriate resistivity well log for the environment should be acquired and verified to be of good quality, as well as the correct formation water resistivity (Rw) value used. Special core analysis determination of the (n) saturation exponent and capillary pressure curves should involve careful sample preparation and testing procedures. The result can be a good comparison of log-derived water saturation with core-derived water saturation with both oil base and water base muds, as shown in Figure 8.
Special Cases
Transition Zone
In the transition zone of a reservoir, both the formation water and hydrocarbons may be mobile, and therefore, either or both may be displaced by the invading mud filtrate. The fluid composition may also be affected by gas expansion. Consequently, the water saturation value derived from cores taken in the transition zone of a reservoir, especially in the lower part of the transition zone, may not be reliable. Saturation-height functions derived from well log calculations using the saturation exponent (n) established by special core analysis, grouped into porosity bands (often 2% porosity bands are used), is often the preferred method of distributing fluid saturations in the transition zones of hydrocarbon reservoirs for the purpose of hydrocarbon in place calculations.
Aquifer
Within the aquifer beneath a hydrocarbon reservoir, it can be useful to establish the remaining oil saturations. The most appropriate technique in the aquifer is to use water base drilling and coring fluids, and then drill the core plug samples with water.
Very Low Permeability Gas Reservoirs
Some very low permeability gas reservoirs, including a number of tight gas and shale gas reservoirs, exist in conditions of “sub-irreducible” water saturation. With limited mud filtrate invasion during drilling and coring, this can result in a significant invasion profile visible on the various resistivity log readings over a range of depth on investigation. Due to the adverse capillary nature of such very low permeability systems, they can both imbibe and permanently retain water base mud filtrate to create a “water block.” If deep invasion occurs, this can result in very high water saturations in the core.
Using oil base muds (preferably) or a tritium tracer based mud system, low invasion coring technology, taking plugs from the center of full diameter cores and avoiding the very top of each cored section for the plug samples all help to generate definite in-situ water saturation measurements and prevent incorrect fluid saturations being reported due to this phenomenon.
Sidewall Core Samples
Sidewall cores are obtained from the flushed zone adjacent to the wellbore and, therefore, tend to be heavily invaded by mud filtrate. They are, therefore, not generally suitable for use in fluid saturation measurements, especially when water base drilling muds are used. If an oil base mud system has been used for drilling the section of the well, sidewall core samples can sometimes be used for an approximate estimate of the fluid saturations, but only if there is no full diameter core available in the well.
