Related Articles


Learning Objectives
After completing this topic “Fluid Saturation”, you will be able to:
- Describe how the calculated fluid saturations are used to estimate the hydrocarbons in place and to predict the fluids to be produced from completed wells.
- Describe the borehole nomenclature and environment, and the effect of the drilling process on the local fluid saturation.
- Apply Archie’s equation to calculate the water saturation in clean formations.
- Discuss the effects of using water base and oil base muds on the determination of the fluid saturation.
- Compensate for the effect of clays and shales on the calculated water saturations.
Introduction to Fluid Saturation
The estimation of the fluid saturations in a conventional resource reservoir has a number of significant applications, two of the most important being to determine the volumetric estimates of the initial hydrocarbons in place and to predict the type of fluids to be produced when a well has been completed in a certain interval.
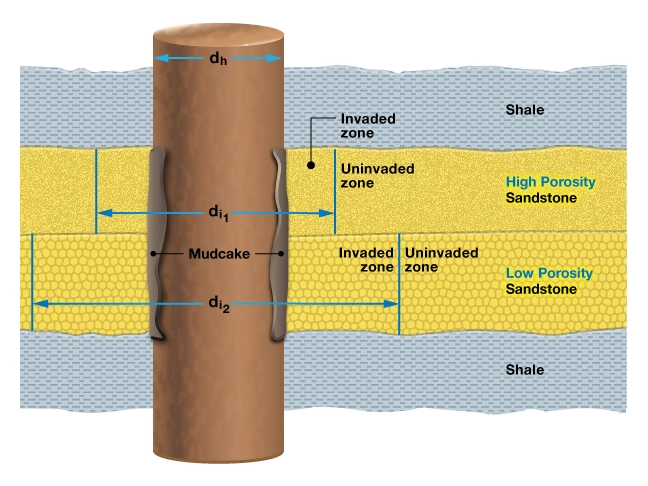
By oil industry convention, it is the value of the water saturation which is normally quoted. The water saturation is the fraction of water in a given pore space. It is usually expressed as a percentage or as a decimal for use in hydrocarbon volumetric calculations. Unless otherwise stated, the water saturation is the fraction of the formation water in the virgin (uninvaded) zone of a reservoir rock (Figure 1). The saturation is known as the total water saturation if the pore space is the total porosity, but is known as effective water saturation if the pore space is the effective porosity. If used without qualification, the term usually refers to the effective water saturation.
Volumetric Estimates of the Initial Hydrocarbons in Place
In order to establish the original hydrocarbons in place, the stock tank oil initially in place (STOIIP) and gas initially in place (GIIP) in a conventional resource reservoir, input parameters are required.
Oil Reservoirs
For an oil reservoir, or for the oil column within an oil reservoir with an original gas cap, the stock tank oil initially in place, STOIIP, is calculated as follows:

Where:
N= stock tank oil initially in place, in stock tank barrels (STOIIP)
7,758= barrels in an acre-foot
ϕ= average porosity (thickness-weighted mean of the porosities) in the oil zone
Sw= average (volume-weighted mean) water saturation in the oil zone
A= area of the oil zone, in acres
h= average net thickness (product of the gross thickness × the net/gross ratio) of the oil zone in feet
Boi= initial formation volume factor (reservoir barrels [RB] / stock tank barrels [STB])
The formation volume factor of the oil, which converts reservoir volumes to surface, stock tank volumes, is generated from laboratory measurements made on the oil samples from the reservoir. It does not vary significantly across the reservoir in comparison to the rock related properties.
The calculated STOIIP is usually rounded to the nearest thousand (sometimes to the nearest ten thousand) stock tank barrels (MSTB), which avoids giving a false impression of very high accuracy and precision. If there is a significantly long oil-water transition zone relative to the entire hydrocarbon-bearing reservoir thickness, the average water saturation can be weighted accordingly. When the transition zone occupies a high percentage of the reservoir, as in the case of a low permeability, thin reservoir, it is more accurate to calculate the oil initially in place in the transition zone separately.
The solution gas dissolved in the oil at the initial reservoir conditions may be calculated as follows:

Where:
N= stock tank oil initially in place (STB)
Gsi= solution gas initially in place (SCF)
Rsi= initial solution gas/oil ratio (SCF/STB)
The solution gas initially in place is usually rounded to the nearest thousand standard cubic feet (MSCF).
Gas Reservoirs
For a non-associated gas reservoir, or for an original gas cap above an oil reservoir, the free gas initially in place (GIIP) is calculated as follows:

Where:
GFi= GIIP (free gas initially in place) in standard cubic feet (SCF)
43,560= cubic feet in an acre-foot
ϕg= average porosity (thickness-weighted mean of the porosities) in the free gas zone
Swg= average (volume-weighted mean) water saturation in the free gas zone
Ag= area of gas cap or gas reservoir, in acres
hg= average net thickness of gas cap or gas reservoir, in feet
Bgi= initial formation volume factor (RCF/SCF)
The free gas initially in place is usually rounded to the nearest million standard cubic feet (MMSCF). The porosity and water saturation should be the volume weighted averages within the gas cap, or within the gas reservoir.
The condensate in the vapor phase at initial reservoir conditions is calculated as follows:

Where:
Ci= condensate initially in place, in STB
Cvi= initial condensate/gas ratio (STB/SCF)
GFi= free gas initially in place, in SCF
The condensate initially in place is usually rounded to the nearest thousand stock tank barrels (MSTB).
Fluids Produced After a Well Has Been Completed
To be able to predict if a completed well will produce water as well as hydrocarbons, it is essential to understand the irreducible water saturation level, the transition zone, capillary pressures, structural elevation and their interrelationships.
Irreducible Water Saturation
Several interrelated factors are intimately tied to the amount of non-producible, bound water (Figure 2) that a reservoir can hold. Although not produced, this bound water is detected and measured by resistivity tools, most of which do not usually distinguish between freely producible water and immovable, bound water.
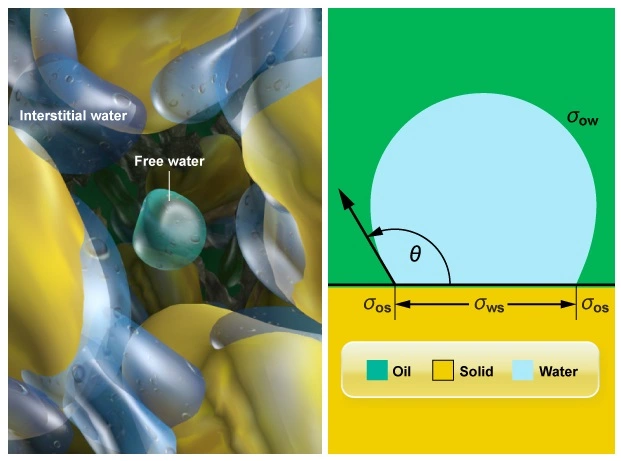
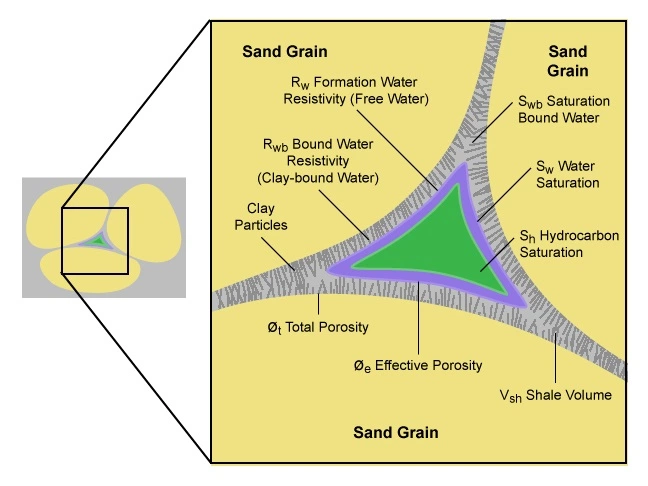
Figure 3 shows the water in a reservoir at the intergranular scale.
Irreducible water saturation, sometimes termed the critical water saturation, is the maximum water saturation that a formation with a given permeability and porosity can hold without producing water alongside the hydrocarbons. Irreducible water, although present, is held in place by capillary forces and will not flow. Critical water saturations are usually determined through special core analysis (SCAL) studies.
The irreducible water saturation value should be compared to the reservoir’s in-place water saturation calculated from the logging while drilling (LWD) and wireline logs. If the in-place water saturation does not exceed the critical water saturation value, then the well will produce only hydrocarbons with no water. These water saturation comparisons are particularly important in low permeability reservoirs with a high shale content, where the critical water saturation can reach 60% in some extreme cases while still producing only hydrocarbons.
Transition Zone
If a well is completed in the transition zone, then it is likely that both water and hydrocarbons will be produced. Reservoirs with large pore throats and high permeability have relatively short transition zones, and vice versa (Figure 4). The transition zone at a gas-oil contact will be shorter than that at an oil-water contact because of the interphase density differences involved.
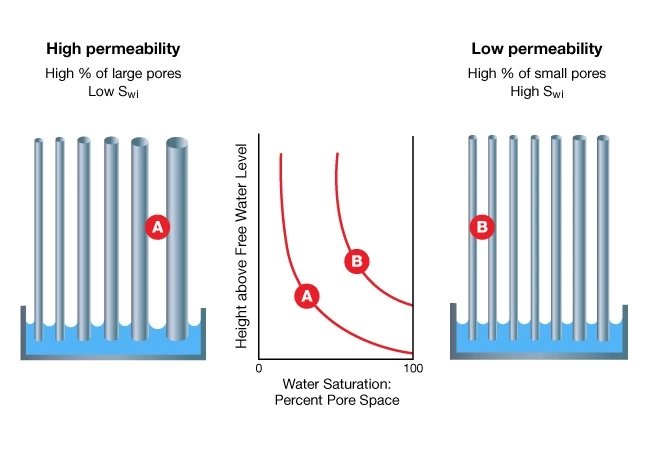
Since a formation’s pore system is made up of a variety of pore sizes and shapes, no single pore throat radius can be assigned to a reservoir as a whole. Depending on the size and distribution of the pore throats, certain available pore channels will raise water above the free water level. The water saturation above the top of the transition zone will, therefore, be a function of the reservoir’s porosity, permeability and pore size distribution.
In a water-wet system, the water wets the surface of each grain. At the time that oil migrates into, and begins to fill, a conventional resource reservoir, the capillary pressure effects will be such that the downward progress of oil as it fills the reservoir is most strongly resisted in the smallest capillaries. Large diameter pores offer little resistance, as the capillary pressure is low because the pore radius is large. Small diameter pores offer greater resistance, as the capillary pressure is high because the pore radius is small. For any given reservoir, the densities of the oil and water, ρo and ρw, determine the pressure differential that an oil-water meniscus can support.
Capillary Pressure and Irreducible Water Saturation
The maximum oil saturation is controlled by the relative number of small and large capillaries, or pore throats. The maximum possible oil saturation is a result of the minimum possible water saturation, referred to as the irreducible water saturation, Swi.
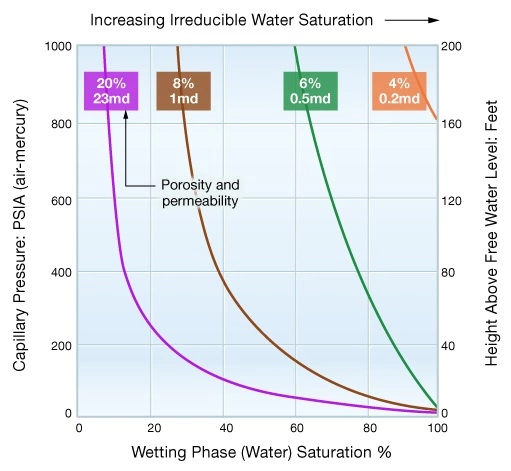
Shaly, or very fine-grained silty, low permeability formations with their small pore throats and high capillary pressures tend to have high irreducible water saturations. By contrast, coarse-grained, clean sandstones of high permeability have low irreducible water saturations. Figure 5 illustrates this concept by comparing the capillary pressure curves for four formation types with differing porosities and permeabilities.
Structural Elevation Within the Reservoir
Gravity segregation over geological time causes a natural stratification of the reservoir fluids, with gas on top of oil and oil above water. In the absence of any rock pores, the gas, oil and water would form distinct layers, with sharp contacts between each phase. In a real reservoir situation, however, the contacts between each phase are less distinct.
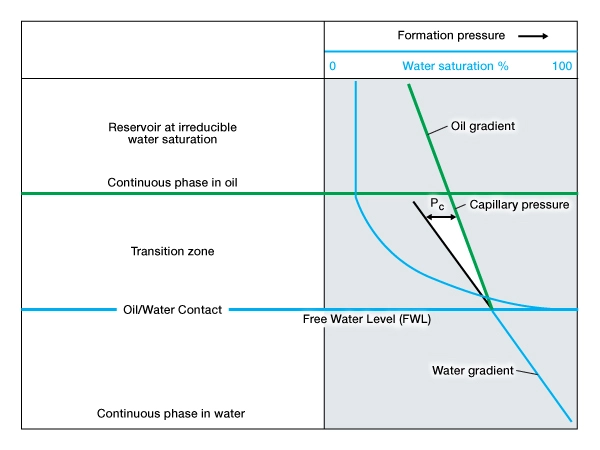
Figure 6 is a pressure versus true vertical depth plot, which divides the reservoir into three levels. The upper level is mainly oil; the lower level is all water, while the middle level shows ever-increasing percentages of water as the depth increases. Plotted on the right-hand panel is a curve of water saturation versus the vertical depth, together with a plot of the fluid pressure in the pore spaces.
Whenever a formation is at irreducible water saturation above the top of the transition zone, the product of the porosity, ϕ, and the water saturation, Sw, is a constant. Variations of porosity are normal on a local scale, caused both by variations in the depositional environment and by subsequent diagenesis. If the porosity is reduced locally, then either a greater proportion of pore throats will be small, or there will simply be fewer pore throats. In either case, the mean radius of the pore throat, r, will be smaller. Consequently, the capillary pressure will be larger, and more water can be held in the pores, maintaining the constant:

After the logs in a well have been petrophysically analyzed to generate estimates for the porosity and the water saturation, a plot of ϕ versus Sw differentiates those data points which are above the top of the transition zone from those which are within the transition zone.
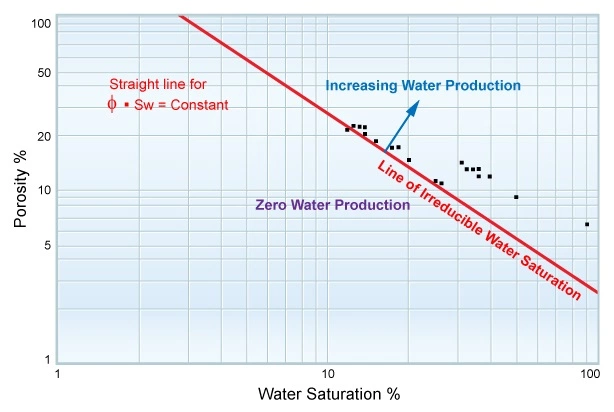
Figure 7 is a crossplot of porosity versus water saturation on a log-log scale, where the points at irreducible saturation plot along the red straight line, and the points in the transition zone plot to the top right of this irreducible line.
By plotting the product, ϕ⋅Sw, it is possible to predict certain production characteristics for a completed interval in a well when hydrocarbon production begins. For points with water saturations above the irreducible water saturation level, some water production is to be expected, depending on the mobility ratio,  , for the particular fluids present. In low porosity, low permeability formations, high water saturations can be tolerated without concern of water production together with the hydrocarbons. Conversely, in other formations that exhibit very good porosity and permeability, even moderate values of Sw often mean that some water production should be expected.
Since both capillary pressure and relative permeability data are strong functions of the pore size distribution and geometry, they will often fall into groups that correlate with specific reservoir facies. Two different reservoir facies may show very different relative permeability relationships, even though their other reservoir properties, such as porosity or permeability, may be very similar. Figure 8 shows water-oil relative permeability curves for two samples with almost identical permeabilities, taken from two different geological facies.
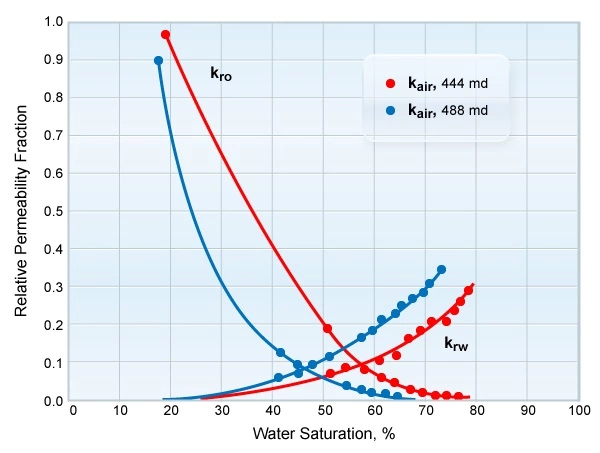
The difference in the measured relative permeabilities illustrates the importance of the pore system configuration in determining the fluid flow characteristics.
The evaluation of capillary pressure and relative permeability data for specific geological facies can help to determine the oil-water and gas-water contact elevation. The oil-water contact elevation can occasionally be substantially different from the free water level. However, the free water level will be at a constant elevation throughout the reservoir, providing the reservoir is in a state of gravity-capillary equilibrium with no significant flow occurring. The producing oil-water contact is often taken as the highest elevation where 100% water is produced. This depth will not necessarily be exactly the same at all points in the reservoir, even under equilibrium conditions. It will depend on local capillary pressure and the relative permeability characteristics of the rock.