Related Articles


Grain Size Distribution
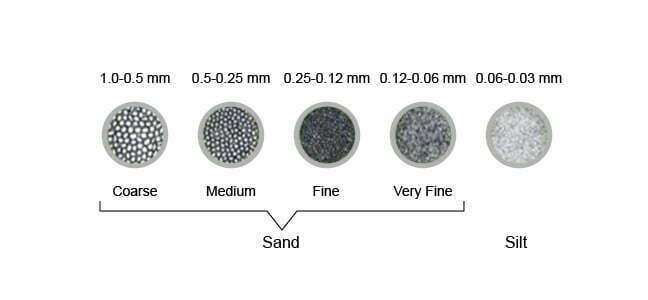
The grain size distribution (Figure 1), affects both porosity and permeability, and is an important indicator of reservoir quality. Generally, the more uniform the grain size, the higher the porosity and permeability. However, porosity is actually independent of grain size. Studies have shown that both silt-sized and coarse-grained sands may exhibit essentially the same porosity, but the coarser-grained rock will have much higher permeability.
The grain size distribution of sandstones is often determined by grain size analysis. These data are one of the indicators of the depositional environment. The particle size analyzer often used in sidewall core analysis provides a rapid measure of grain size distribution and, with it, a better estimate of the permeabilities on these small samples. Grain size data are also used for sizing the gravel packs that are installed in well completions to prevent sand flow into the wellbore.
Two basic analytical techniques for estimating grain size distribution are sieve analysis and sedimentation analysis based on Stokes’ Law.
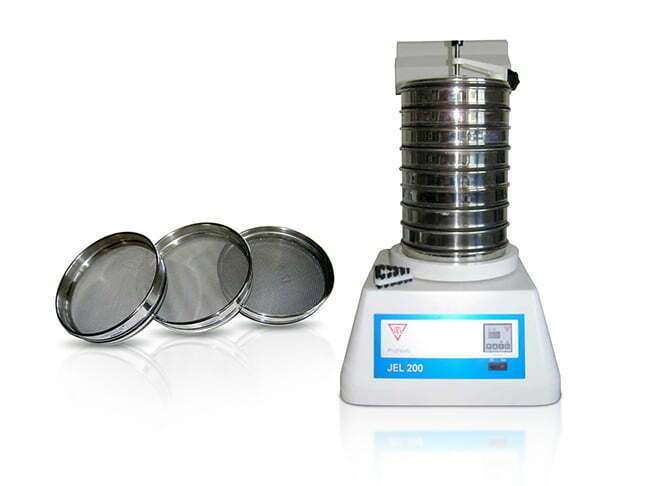
Sieve Analysis Technique
This method involves sieving a disaggregated core sample through a series of dry screens with increasingly finer mesh (Figure 2).
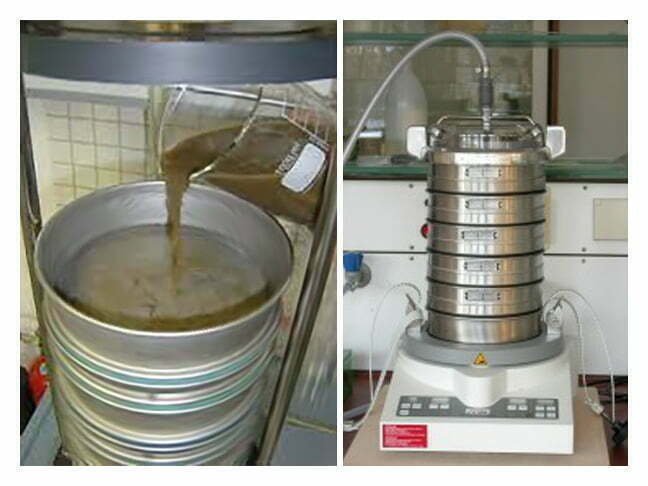
Difficulties occur in this technique because the electrical attraction between disaggregated clay particles causes them to clump and not pass properly through dry screens. This can be remedied by using a wet technique in which the finer clay particles can be washed through a 230 mesh sieve (0.0625 mm) to remove the clay (Figure 3). The remaining portion of the sample is then passed through a nest of variously sized screens, and the portion remaining on each screen is weighed.
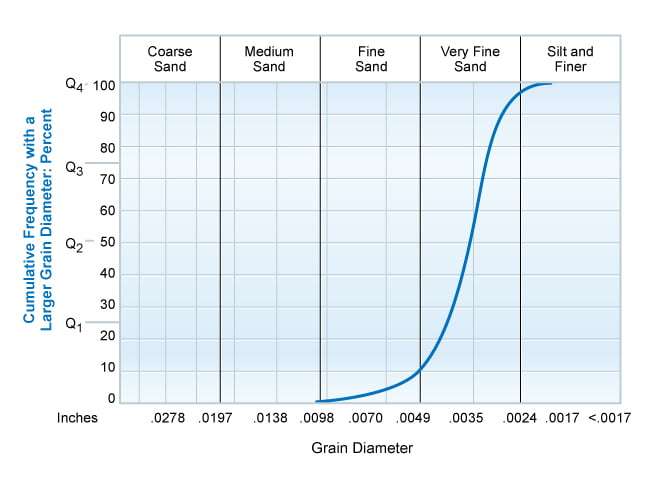
It is common to present the grain size distribution as a function of cumulative weight percent of the total sample, as shown in Figure 4, normally an S-shaped curve.
The farther to the left on the horizontal axis that the distribution curve falls, the coarser the material. The more uniform the sample, the more vertical the S shape. A completely uniform sample would result in a vertical line.
Sedimentation Technique
The second analytical technique for measuring the grain size distribution utilizes the principles of Stokes’ law on the settling time of free-falling grains in a liquid column. The sample is carefully disaggregated and weighed, and then placed in a holder where ultrasonic agitation completely disperses the particles and detaches clay from any sand-sized grains. The dispersed sample is then spread evenly and simultaneously over the surface of the solution in the settling tube. Particles falling to the bottom of the tube collect on a balance as a function of time. Weights are monitored electronically and transmitted to a computer. The analyzed results generate both tabular and graphical data similar to that illustrated in Figure 4.
A sample may be characterized mathematically by: (1) its standard deviation, which indicates the degree of sorting, and (2) the median grain diameter. A grain size distribution that is not symmetrical around the mean grain size is said to be skewed. The coefficients of skewness are calculated, as well as the relationship of the total height of the distribution to its base width. This is referred to as the peakedness, or kurtosis, of the distribution. The Trask (1932) sorting coefficient is an indicator of the degree of sorting, with the value of 1.0 representing a well-sorted sample. The Trask sorting coefficient is defined as “the square root of the ratio of the 75th and 25th percentiles”. This ratio works well as a sorting indicator because it can be interpreted as an estimate of the spread.
Firmly cemented samples pose problems in measuring grain size distribution. The two most common types of cement are carbonate and silica. Carbonate cement can be removed by washing the core with dilute hydrochloric acid. If the sample is cemented by silica, it may be impossible to disaggregate it without crushing the grains; the only available technique for determining grain size distribution would then be the use of thin sections. Even in cemented sandstones, the grain size distribution is a helpful indicator of the rock quality and has been used successfully in studies of both ditch cuttings and cores. While grain size distribution is an indicator of the depositional environment in general and its energy in particular, it should be supplemented with lithology and biostratigraphy data to be more definitive.
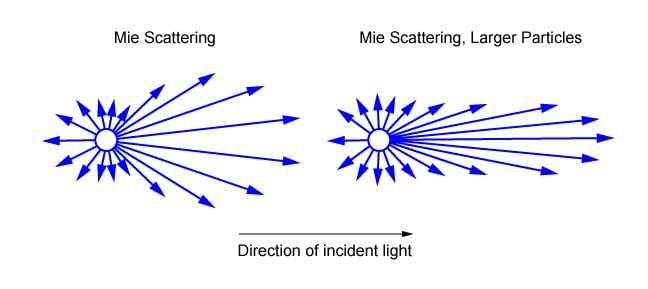
Laser Diffraction Technique
Some laboratories use the laser diffraction technique to establish the grain size distribution. Laser diffraction measures the particle size distributions by measuring the angular variation in the intensity of light scattered as a laser beam passes through a dispersed particulate sample. Large particles scatter light at small angles relative to the laser beam, and small particles scatter light at large angles. The angular scattering intensity data is then analyzed to calculate the size of the particles responsible for creating the scattering pattern, using the Mie theory of light scattering (Figure 5). The particle size is normally reported as a volume equivalent sphere diameter.