Day 3
By Day 3 the “last chance marker” was cut 61 feet above the Top of Target A, at an inclination of 62 degrees (see Figure 4 and Figure 5).

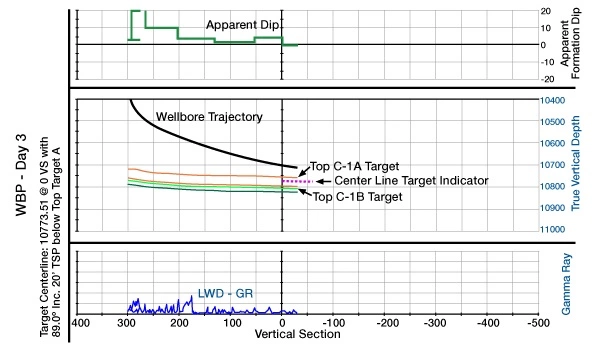
By this time, the apparent formation dip had flattened to less than 1 degree. Because a point of change had already been pre-planned for the “last chance marker,” this target change was faster and easier to communicate. No trip was needed to adjust the BUR, which had been accomplished by alternating between sliding and rotating to obtain the desired BUR. The flattening of the dip required a steeper build from the assembly. The target was adjusted and the build was increased to land on the target line without requiring a trip.
Day 4
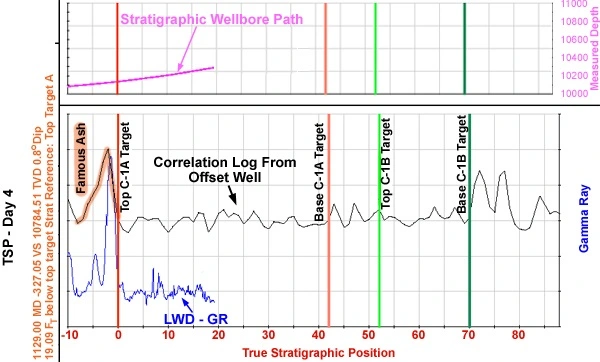
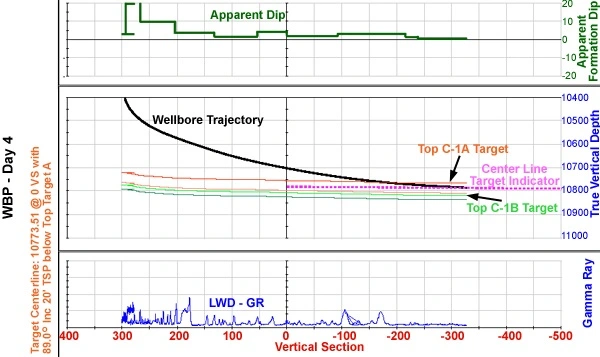
The well drilled through the “Famous Ash” interval, which was easily identified on the LWD Gamma Ray. In the mudlogging unit, samples from the “Famous Ash” display a bright yellow mineral fluorescence that is difficult to miss. The Top of the target was cut on day 4 at a measured depth of 11,138 feet, as seen on the LWD gamma ray log. The dip was essentially unchanged, so no change was made in the target line (Figure 6 and Figure 7).
Day 5
The first major fracture set was cut on Day 5. At a depth of 11,680 feet MD and 36 feet TSP relative to the top of target “C1a“. (See Figure 8 and Figure 9).
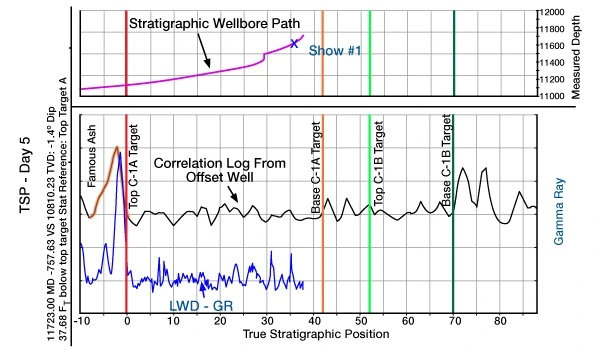
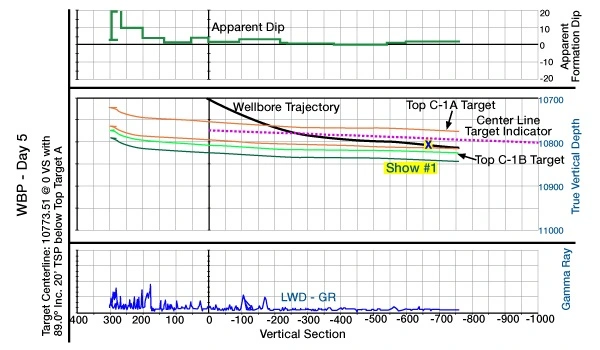
The well lost partial returns and then flowed back as it cut across the fractured interval. The well had a 30-foot flare with a CP of 600 pounds.
 Petro Shine The Place for Oil and Gas Professionals.
