Measuring Compensation, Loads and Deflections
We use compensation models to make quantitative predictions of the timing and shape of subsidence within a basin. Using a process/response framework for analyzing basin subsidence histories requires us to choose a compensation model, estimate the parameters of the model (e.g., densities, lithospheric rigidity), and calculate or estimate loads and deflections. The accuracy of our predictions depends on how accurately our compensation model describes the actual support mechanisms, and how accurately we can estimate model parameters, load magnitudes, and timing and deflection histories.
We apply Airy or flexural compensation models based on the load support mechanisms we assume and the accuracy we want in our result. For example, we commonly apply flexural models to foreland basins because these basins form on older, thicker and more rigid crust that is capable of partially supporting thrust loads. We commonly apply Airy models to rift basins because we assume that young, hot lithosphere and faulting reduce the lateral strength of the lithosphere and that most of the load is supported with asthenospheric buoyancy. While we can use Airy models to predict gross shapes and the timing of passive margin subsidence, we need flexural models to more accurately calculate deflections due to additional sediment loads and to predict stratigraphic architecture (Steckler, Watts and Thorn, 1989).
Another way we can apply compensation models is to directly measure some attribute that indirectly relates to the form of past compensation mechanisms. If a load is isostatically compensated, column weights will be equal above a depth of compensation. Gravity anomalies may indicate situations where column weights are not equal, and thus the degree to which isostatic compensation has not been achieved. We can use Bouguer and free-air gravity anomalies jointly to determine subsurface density distributions and degrees of compensation.
A load that is compensated locally will not have a free-air anomaly because its mass will be compensated with changes in subsurface density distributions, which we can estimate from Bouguer anomalies. For example, large-scale (i.e., greater than 100 km) topographic loads in mountain ranges are compensated with low-density roots in the crust, but small-scale topographic loads are not compensated. Consequently, large-scale topographic loads that are compensated have no free-air anomalies, but they do have Bouguer anomalies that indicate the low density of their compensating roots. Small-scale topographic loads have no Bouguer anomalies or free-air anomalies that reflect the magnitude of the load (Figure 1, Free-air and Bouguer gravity anomalies associated with a topographic profile across a mountain range.
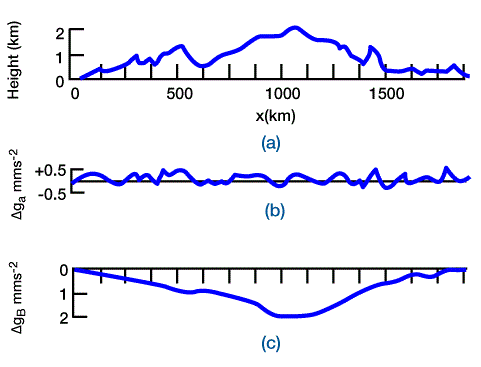
The free-air anomalies [b] are associated with uncompensated, short-wavelength topographic loads. The Bouguer anomalies [c] reflect the low density root associated with the compensated, long-wavelength topographic load of the mountain.). Gravity anomalies have been interpreted as evidence of flexural support of loads within foreland basins (Karner and Watts, 1983) and along passive margins (Walcott, 1972; Keen et al, 1981; Karner and Watts, 1982).
Keen et al. (1981) interpreted the free-air gravity signature over the Nova Scotia margin as evidence of flexural support of sediment loads on a passive margin. They modeled the evolution of the thermal structure, subsidence profile, flexural response to sediment loads and free-air gravity anomalies of the Nova Scotia margin using a thermo-mechanical model. The thermal structure and basin subsidence history was modeled with a laterally varying stretching factor, b (McKenzie, 1978). Because elastic thickness, h, was defined as an isotherm, flexural rigidities, and thus flexural deflections due to sediment loads, could be calculated for each time. Density variations due to distribution of sediment and water loads, position of the crust-mantle boundary and temperature structure were calculated with the thermo-mechanical model and used to calculate free-air anomalies during basin evolution. Only the present free-air anomaly prediction can be compared with actual data and the match is interpreted as evidence of flexural support for sediment loads.
Once we choose our compensation model, we must measure or estimate appropriate model parameters, loads and deflections. Model parameters must have reasonable geologic values and we estimate them by finding values that allow model outputs to most closely match the observed stratigraphic or gravity data.
We measure timing and the magnitude of deflections and sediment loads from stratigraphic data, such as the thickness and geographic extent of units. The magnitude of deflection due to a loading history is equal to the stratigraphic thickness represented by the loading history. If we model a history of deflections, we must reconstruct the subsidence history of stratigraphic units using palinspastic reconstructions for faulted units and geohistory analyses. We might also include reconstructions of paleo-water depths and estimations of eroded sediments in our analysis.
Tectonic loads are often the most difficult parameters to estimate because supracrustal loads are often partially or completely eroded and subcrustal loads can not be measured directly. Consequently, the greatest errors and uncertainty arise from estimating tectonic loads. Gravity measurements reflect the distributions of gross density contrasts, but have poor resolution and provide no information about the timing of load emplacement. Indirect evidence, such as stratigraphic architecture, subsidence history profiles from geohistory analyses or petrologic and paleodrainage evidence indicating provenance from a supralithospheric load, may provide time constraints on load emplacement. Jordan (1981) provides an example of applying a flexural model to palinspastically reconstructed thrust loads in the western United States using well-constrained load measurements.
If we cannot directly measure tectonic loads, then we can estimate magnitudes and emplacement timing using geodynamic models, such as a McKenzie stretching model, or by using models to fit available indirect evidence to observed data. For example, we can fit loads in compensation models to either stratigraphic data or present gravity anomalies. Stratigraphic data can consist of the thickness of stratigraphic units or basin shape (Jordan, 1981; Royden et al., 1987) or changes in the stratigraphic thickness and geographic extent of units (Sleep and Snell, 1976; Beaumont, 1981; Nunn and Sleep, 1984; Quinlan and Beaumont, 1984).
Figure 2, (Deflections of lithosphere with different flexural rigidities, due to the same load.
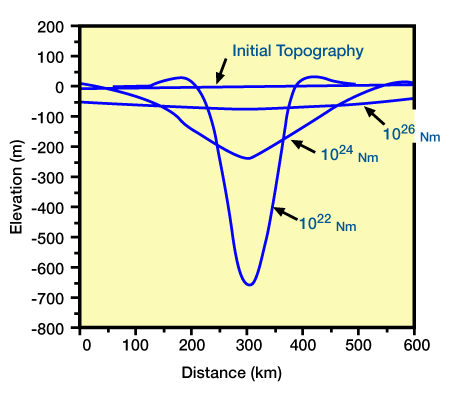
The load is 40 km wide, 1000 m high, and has a density of 2.5 gm/cm3. Subsidence is filled with water and the initial topography is horizontal), Figure 3, (Deflections of lithosphere caused by loads with different magnitude.
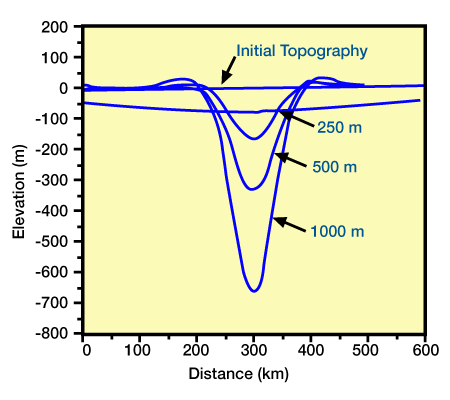
Flexural rigidity is 1022 Nm, the initial topography is horizontal, and subsidence is filled with water. Each load has a width of 40 km and a density of gm/cm3, but their heights are 250 m, 500 m, and 1000 m.), Figure 4, Deflections cause by variations in the replacement mass.
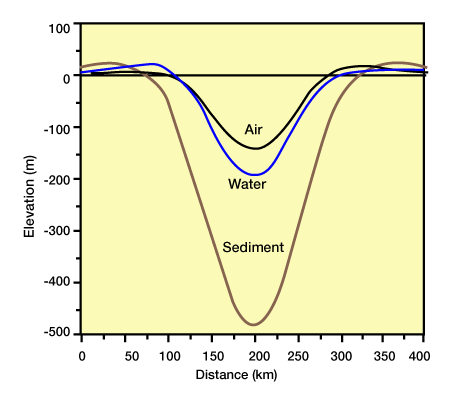
For each calculation, the load magnitude and dimension were equivalent, but the replacement masses were different. The load is 90 km wide, 200 m high, and has a density of 2.5 gm/cm3. Flexural rigidity is 1022 Nm. Subsidence is filled with air [no density], water [1.0 gm/cm3], and sediment [2.5 gm/cm3].) illustrate variations in deflection form and magnitude due to load magnitudes and dimensions and model parameters, such as flexural rigidity and densities. Basin shape and final topography can also vary with changes in the initial topographic profile that the loads deflect (Figure 5, Effect of initial topography on flexural compensation of a load.
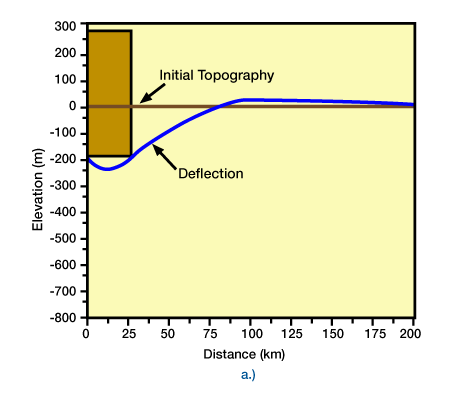
Initial topography was horizontal.) and (Figure 6, Initial topography was inclined)
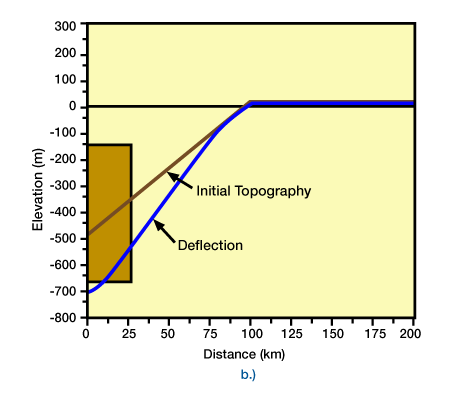
In each model, the land was 25 km wide, 500 m high, and density was 2.5 gm/cm3. Subsidence was water-field. If the load is supralithospheric, the final topography would be below the original topography for Figure 6, but above topography for, Figure 5.). Commonly, we estimate these parameters and loads with model fitting to stratigraphic thickness and distribution data, or to other geologic evidence such as stratigraphic architecture, subsidence histories, or provenance studies. Unfortunately, compensation models are not unique, so our uncertainty in estimating loads with model fitting can be high because we must also estimate model parameters and initial conditions.
The “missing load” problem illustrates the uncertainties in tectonic load, parameter and initial topography estimates due to the lack of uniqueness in model fitting. Gravity anomalies and basin shapes have been used to infer existence of tectonic loads other than thrust loads in specific foreland basins (Karner and Watts, 1983; Royden and Karner, 1984; Royden et al, 1987). These loads might consist of subsurface density anomalies, forces caused by subduction processes, or lithospheric thinning. Assuming that tectonic thrust loads can be calculated with topographic profiles, geoscientists have argued that thrust loads are insufficient for the observed basin deflections or gravity anomalies and have inferred that some other “missing” load must exist. However, other explanations are equally plausible. One suggestion is that the same measured loads placed upon already stretched, thinned and weakened lithosphere might also account for the observed data (Stockmal et al, 1986).
 Petro Shine The Place for Oil and Gas Professionals.


