Solution Gas Drive
Production Mechanism
A solution gas drive reservoir is one in which the principal drive mechanism is the expansion of the oil, the expansion of the gas dissolved in the oil, and the expansion of the rock with its associated water. Two phases of production may occur in such reservoirs. The first phase is that in which the pressure is above the bubble-point value. During this period, no free gas phase exists and the reservoir oil is undersaturated. The second phase occurs when the pressure falls below bubble-point and a free gas phase exists.
Undersaturated Reservoirs (Expansion Drive)
For these reservoirs there is no initial gas cap; that is, m = 0 in the material balance equation (MBE). Furthermore, Rs=Rsi=Rp, since all the gas produced at the surface has been dissolved in the oil. In addition, Bt=B0, and it is assumed that the water influx (if present) is negligible. The MBE reduces to
![]()
or
![]() ……….. (38)
……….. (38)
However,
![]() , and the oil compressibility,
, and the oil compressibility, ![]()
Substituting in the above equation gives
![]()
or
![]() ……….. (39)
……….. (39)
where ce is the effective compressibility of the reservoir and is given by
![]()
With the MBE, the reservoir is viewed as a homogeneous tank where the production is due to the expansion of the systems. Percent recovery (from Equation 39) as the pressure declines is given as
![]() ……….. (40)
……….. (40)
Example 2 illustrates the calculation of the fractional recovery in an undersaturated reservoir when the pressure drops from 4500 psia to the bubble-point value of 4000 psia.
Example 2
The values for c0, cw, and cr are, respectively, (12, 4, and 8)⋅10−6 per psi, and Boi, and B0 are 1.24 and 1.25 reservoir bbl per STB.
The initial water saturation = 0.2.
We simply substitute into Equation 40 to find
![]()
![]()
Example 2 illustrates two important points. The first is that recovery by expansion above the bubble-point is typically very small. Thus, expansion drive above the bubble-point makes the smallest contribution to the overall production mechanism. The second point is that the magnitude of the combined water and rock expansion in ce is comparable to that of the oil and must be accounted for in the calculations.
Saturated Reservoirs
Below the bubble-point, gas will be liberated from the oil and will exist as a free gas phase. A good approximate value for the value of the gas compressibility is ![]() , which is obtained from the definition of compressibility for an ideal gas. Thus, the gas compressibility is generally several orders of magnitude larger than the rock and oil com pressibility. At 4000 psia for example,
, which is obtained from the definition of compressibility for an ideal gas. Thus, the gas compressibility is generally several orders of magnitude larger than the rock and oil com pressibility. At 4000 psia for example, ![]() .
.
To illustrate the relationship between recovery and pressure decline, we return once again to the MBE. For simplicity, assume that at discovery the reservoir had no gas cap. Assume also that the rock and associated water expansion may be ignored, since the gas compressibility is considerably larger. If we also assume negligible water influx, the MBE becomes
![]() ……….. (41)
……….. (41)
The fractional recovery is
![]() at abandonment conditions. ……….. (42)
at abandonment conditions. ……….. (42)
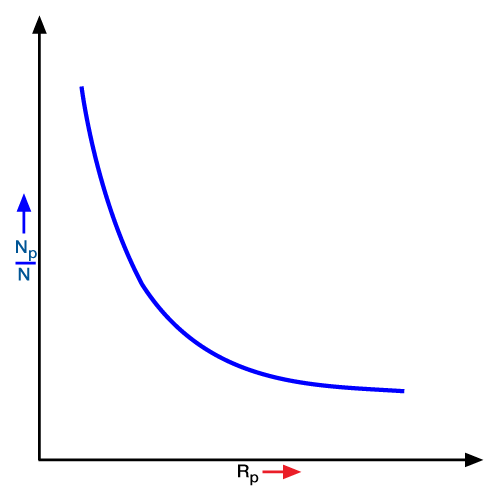
Equation 42 shows that percent recovery is a function of two parameters: the PVT properties of the oil and gas, and cumulative gas production as indicated by Rp For a given oil reservoir, recovery is basically inversely proportional to Rp or the total gas produced at abandonment pressure. This means that in the case of solution gas drive reservoirs, the engineer must strive to minimize gas production to obtain more efficient recovery. The more gas that remains in the reservoir, the larger the amount of energy available for the production of oil. A schematic diagram of the GOR equation, as shown in Figure 1, clearly indicates the adverse effect of gas production on recovery.

 Petro Shine The Place for Oil and Gas Professionals.


