Related Articles


Hydrocarbon Effects
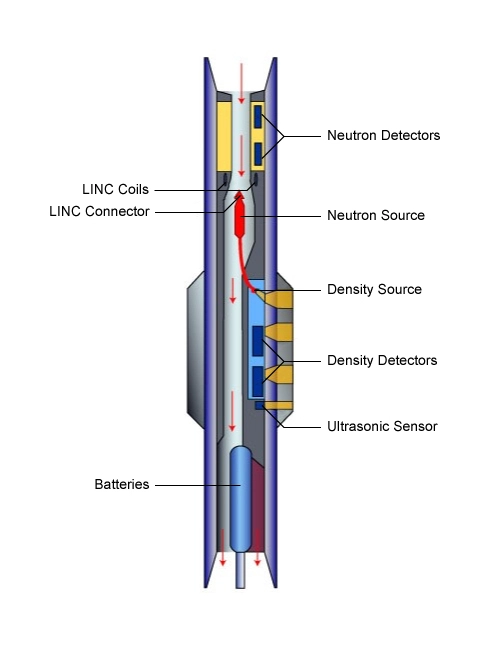
To quantify, and compensate for, the effects of hydrocarbons on logging while drilling (LWD) (Figure 1) and wireline porosity well logs, the basic measurement mechanics of the various logging tools involved must be understood.

Neutron porosity tools (Figure 2) respond to the hydrogen index. Gas and light oils both have a low hydrogen index and, therefore, make the neutron porosity log readings lower than they would have been had water occupied the pore space instead of the light hydrocarbons. However, there is also another effect of gas on the neutron porosity measurements which cannot be explained by the differences in hydrogen index alone, which is termed the “excavation effect.” By using the concept of hydrogen index, the only significant contributor to the neutron porosity in a gas zone is the liquid-filled porosity, since the hydrogen indices of gas and matrix are close to zero. However, the resultant liquid-filled porosity is found to be too low. The error comes from treating the gas-filled porosity as a matrix. If this matrix is “excavated” and replaced with gas, the correct log response can be predicted.
Density logging tools (Figure 2) respond to the electron density, whereas the desired measurement to be obtained for petrophysical evaluations is the bulk density. The electron density is equal to the bulk density multiplied by 2 Z/A, where Z is the average atomic number and A is the average atomic weight of the formation. Because of hydrogen’s unique Z/A ratio, gas and light oils appear less dense than water.
Sonic, or acoustic, logging tools measure the transit time of compressional waves (Animation 1), which travel more slowly through gas than in water.
In summary, in the presence of gas and light hydrocarbons:
- The neutron porosity log indicates less than the true formation porosity.
- The density log indicates more than the true formation porosity.
- The sonic log indicates more than the true formation porosity.
To quantify the effects of light hydrocarbons on porosity, two factors must be known:
- The volume of the pore space occupied by hydrocarbons within the zone of investigation of the specific logging tool
- The response of the specific logging tool to these hydrocarbons
Porosity logging tools have shallow depths of investigation, whether they be run on wireline or as part of the bottomhole assembly as LWD tools. Most of the porosity tools’ responses come from within 12 in. (30 cm) of the wellbore wall. However, density and neutron porosity logging tools read slightly different depths into the formation, complicating the derivation of an accurate porosity in the presence of gas and shallow mud filtrate invasion. On average, the 50% depth of investigation of a typical neutron porosity tool is 6 to 12 in. (15 to 30 cm), depending upon the porosity and gas saturation of the formation, and the 50% depth of investigation of a typical density tool is about 2 to 3 in. (5 to 8 cm). These depths of investigation are overall averages and vary somewhat both between wireline and LWD tools and between the different logging service companies.
When the drilling mud fluid invasion front is greater than 12 in. (30 cm), both the density and neutron porosity tools basically take their measurements from the invaded zone. Even with LWD measurements, which are acquired sooner after drilling a new section of borehole than wireline measurements, this often is the situation. When the invasion front is less than 12 in. (30 cm) but greater than 6 in. (15 cm), the density tool sees only the invaded formation while the neutron porosity tool is sensitive to both the invaded and the non-invaded zones. Below about 6 in. (15 cm) of invasion, both density and neutron porosity tools are sensitive to both the invaded and non-invaded regions. Thus, for a certain range of depths of invasion, accurate determination of formation porosity becomes very difficult in the presence of gas.
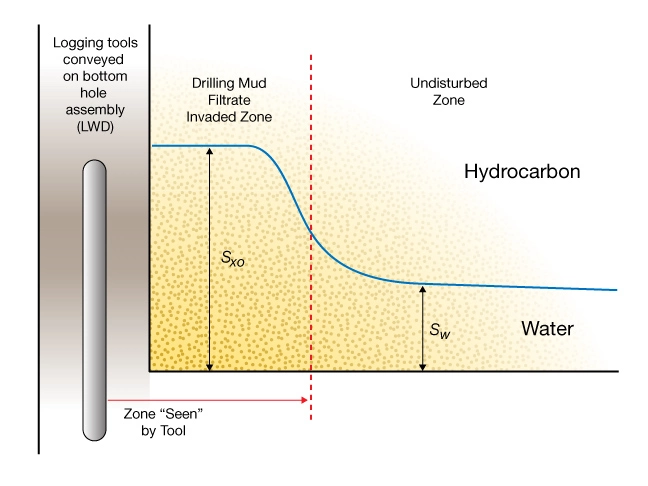
The majority of the porosity log measurements are made in the drilling mud filtrate-invaded zone (Figure 3), where the water saturation is Sxo and the hydrocarbon saturation is (1−Sxo).
Correction for the Hydrocarbon Effect on Log Porosity Measurements
The equivalent porosity of the hydrocarbon depends on its density; this is shown in Figure 4 for typical neutron porosity and density tools.
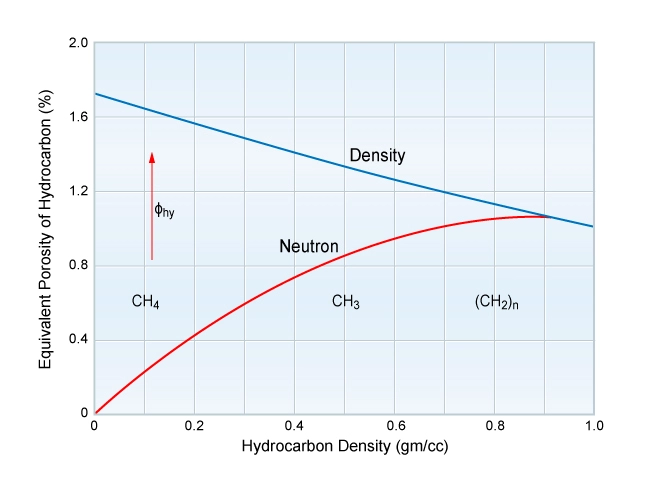
Approximations for these functions are:


Where the subscript “hy” refers to the specific hydrocarbon.
The response of the density tool can be described by:
![\phi _D = \phi _T \left[S_{xo} + \phi _{Dhy}(1 - S_{xo}) \right]](https://petroshine.com/wp-content/ql-cache/quicklatex.com-93f73c23ab925014b76f492a7edb9e6d_l3.png "Rendered by QuickLaTeX.com")
Where:
ϕD is the density porosity.
ϕT is the true porosity.
Thus:

In gas-bearing formations, ϕD is larger than the true porosity, ϕT. For example, if ϕDhy = 1.7, ϕT = 30% and Sxo = 75%, the density log reading can be calculated as:
![\phi _D = 0.3[0.75 + 1.7(1 - 0.75)] = 0.3525\textrm{ or }35.25\%\textrm{ porosity}](https://petroshine.com/wp-content/ql-cache/quicklatex.com-f26b5793f40200ef0a5e23fcc1fd2a9a_l3.png "Rendered by QuickLaTeX.com")
A neutron porosity log under the same conditions would have a ϕNhy of zero,
and so:
![\phi _N = 0.3[0.75 + 0\times(1 - 0.75)] = 0.225\textrm{ or }22.5\%\textrm{ porosity}](https://petroshine.com/wp-content/ql-cache/quicklatex.com-15f17e235fbbf6d59dbd9344ae64bde5_l3.png "Rendered by QuickLaTeX.com")
The log analyst deduces porosity from a measurement distorted by the fluid contained in the pore space. A quick-look method is provided by the Gaymard relationship:

In the above example with ϕN = 22.5% and ϕD = 35.25%, the Gaymard formula gives:

which is a close approximation to the true porosity of 30%.
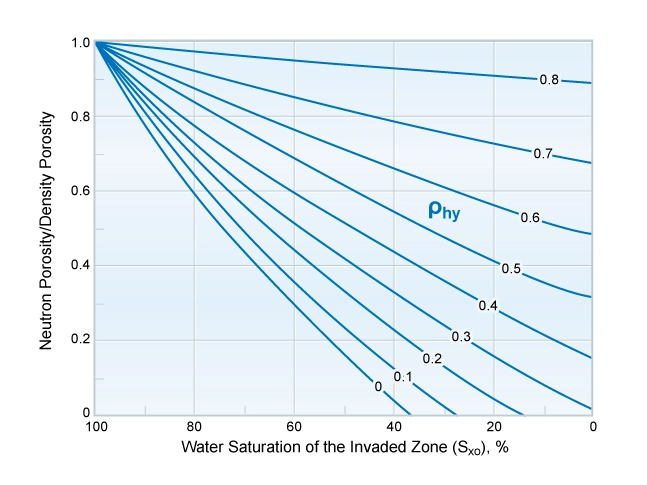
Figure 5 offers a quick-look solution to the determination of ρhy. The ratio of ϕN/ϕD is plotted against Sxo. The curved lines are for values of constant ρhy.
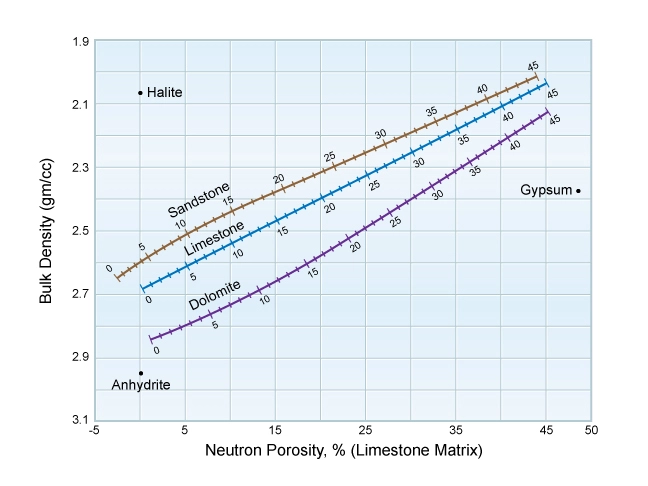
Considerably more rigorous solutions to the challenge of correcting porosity logs for the effect of gas in their investigation zones can be made via iterative procedures that refine the values of porosity, gas density, excavation effect and Sxo using sophisticated petrophysical analysis computer programs. Many of these solutions are based on a density-neutron crossplot (Figure 6), using the specific crossplot configuration appropriate for the fluid density of the drilling mud used in the well. The petrophysicist can input suitable values for the gas density, flushed zone saturation and excavation effect, and iterate the solution for porosity until the resultant computed matrix density has become both stable within 0.01 gm/cc and deemed to be appropriate for the formation in question, ideally as indicated by core analysis.
The arrow on Figure 7 shows the approximate direction of the correction required on density-neutron pairs of log data points for the effect of a typical gas in the zone of investigation.
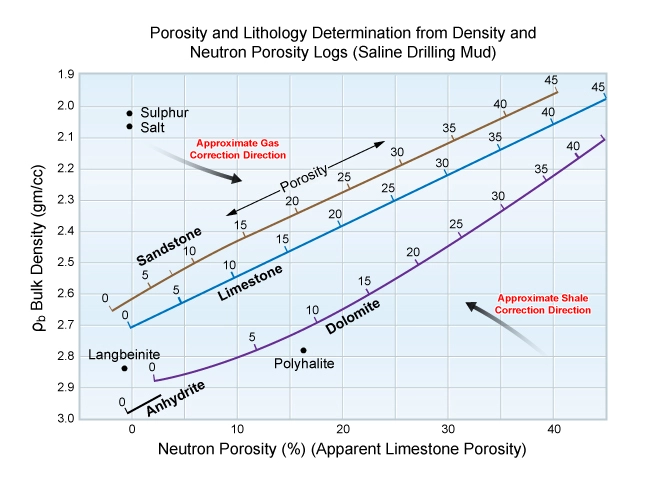
The exact correction direction is a function of the specific gas density in the formation. It is again a useful attribute of the density-neutron crossplot that this gas correction direction is sub-parallel to the lines of equal porosity between the sandstone, limestone and dolomite rock matrices on the crossplot (Figure 8). In general, the gas correction is such as to only slightly move the data points towards a higher final porosity after the gas correction adjustment has been applied. This porosity increase is most marked for dolomitic limestones, reflecting the gas correction direction at a more offset angle to the lines joining equal porosity points between the limestone and dolomite matrices.
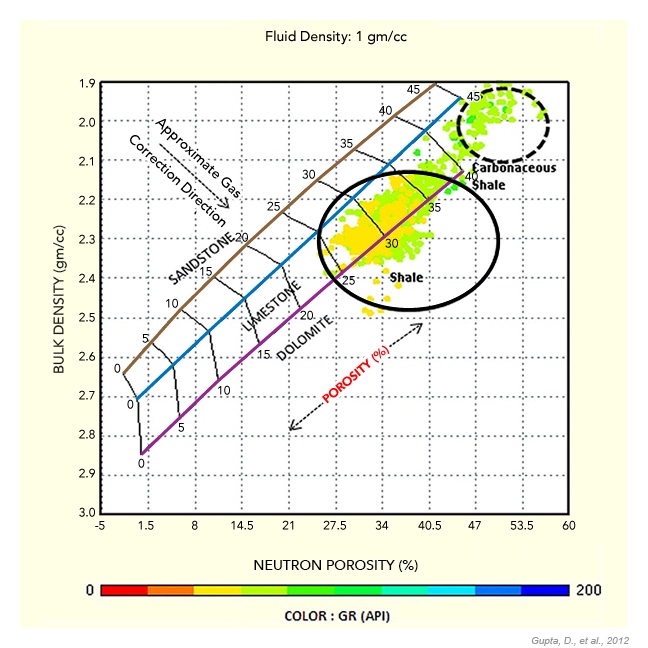
There are several pairs of density and neutron porosity data points, indicated in yellow in Figure 9, which lie to the northwest of the limestone matrix line. These data are from the gas-bearing interval at the top of a limestone reservoir. There are also many light blue data points of varying porosities which plot around the clean limestone matrix line. These data are from the water-bearing interval of the same limestone formation, which appears to have some minor lithology variations.
In order to correct the log porosity data from the gas-bearing interval for the effect of the gas, these data points need to be moved to around the limestone matrix line. Ideally, core analysis data would determine the matrix density of the formation and thus help to fine-tune the correction for the gas effect on the neutron and density logs, in conjunction with a knowledge of the gas density.
In summary, well log porosity calculation is often complex, especially in the presence of both light hydrocarbons and shale. Careful computer processed interpretation of high-quality digital log data by expert petrophysicists, using skillfully selected input parameters and full diameter core analysis results, is the recommended best practice for reliable formation porosity determination.
