ad
GeologyPetrophysics
Trending

Porosity | What is porosity in well logging?

Neutron Log


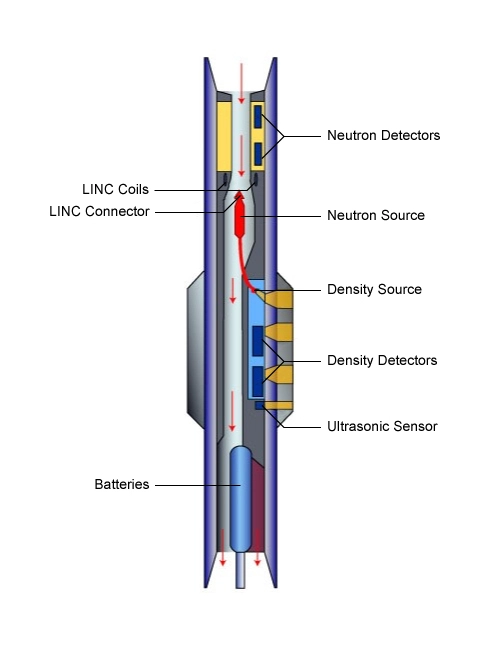
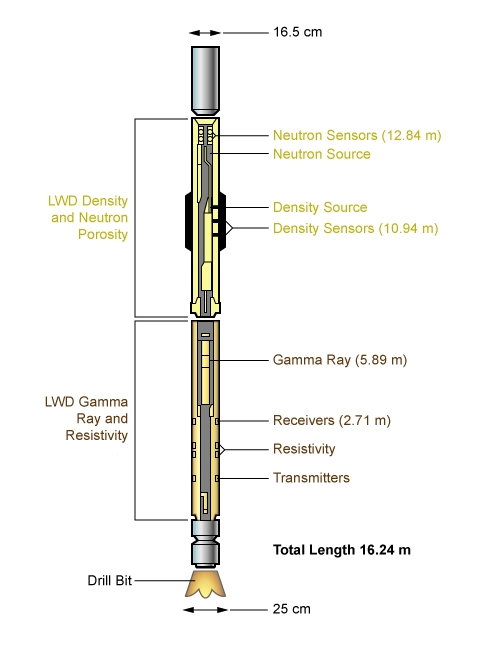
Neutron porosity logging tools, whether logging while drilling (LWD) (Figure 1) or wireline log data acquisition devices, use a neutron source to measure the hydrogen index, which is directly related to the liquid-filled porosity in a clean (shale-free) reservoir formation. The hydrogen index (HI) of a material is the ratio of the concentration of hydrogen atoms per cubic centimeter in the material to that of pure water at 75°F. As hydrogen atoms are present in the pore spaces of both water-bearing and oil-bearing reservoir rocks, measuring their amount with the neutron porosity tool allows an estimation of that porosity which contains liquids.

Logging while drilling density-neutron porosity tool schematic, density-neutron porosity tool schematic, porosity density, porosity, neutron tool, neutron porosity, neutron log, Borehole Wireline, Wireline Logging, well logging, What is porosity in well logging, What is a porosity log, Porosity definition, Well logging porosity, Types of porosity, Porosity measurement, Porosity calculation, Porosity logs, Effective porosity, Formation porosity, Porosity analysis, Porosity interpretation, Porosity determination, Porosity evaluation, Porosity in reservoirs, Petrophysical porosity, Porosity logging tools, Porosity estimation, Porosity models, Porosity control, Porosity saturation, Porosity data, Porosity variations, Porosity distribution, Porosity zones, Porosity anomalies, Porosity characteristics
Figure 1: LWD compensated neutron tool schematic

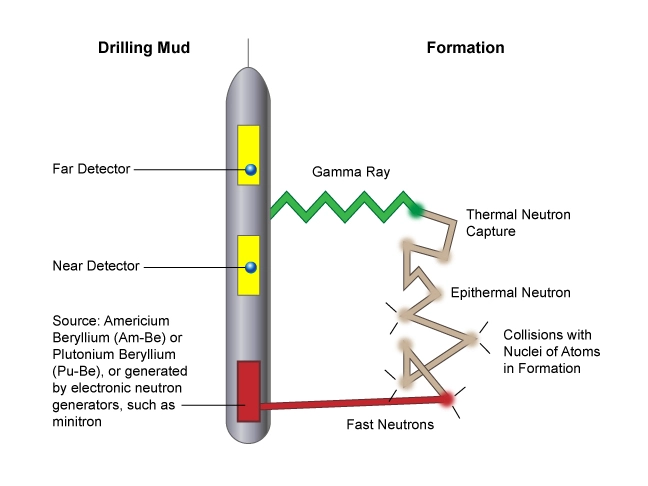
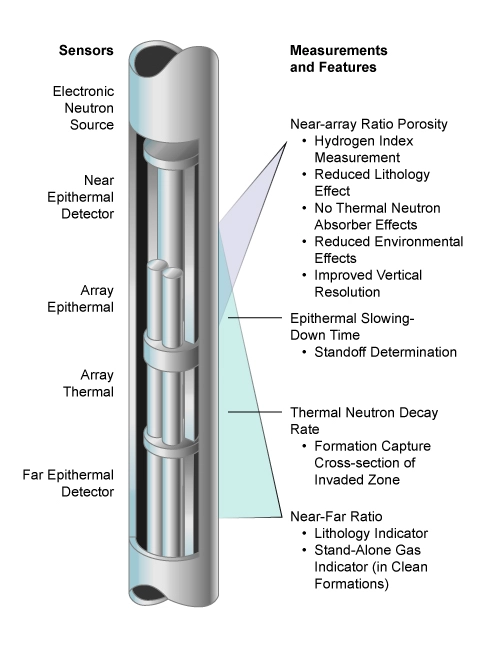
Compensated neutron porosity tools, in which the effects of the local wellbore environment are minimized by using two detectors (Figure 2), are now universally used for new well log data acquisition.

Compensated neutron tool with two detectors schematic, Compensated neutron tool, neutron log, neutron porosity, Borehole Wireline, Wireline Logging, well logging, What is porosity in well logging, What is a porosity log, Porosity definition, Well logging porosity, Types of porosity, Porosity measurement, Porosity calculation, Porosity logs, Effective porosity, Formation porosity, Porosity analysis, Porosity interpretation, Porosity determination, Porosity evaluation, Porosity in reservoirs, Petrophysical porosity, Porosity logging tools, Porosity estimation, Porosity models, Porosity control, Porosity saturation, Porosity data, Porosity variations, Porosity distribution, Porosity zones, Porosity anomalies, Porosity characteristics
Figure 2: Compensated neutron tool with two detectors schematic

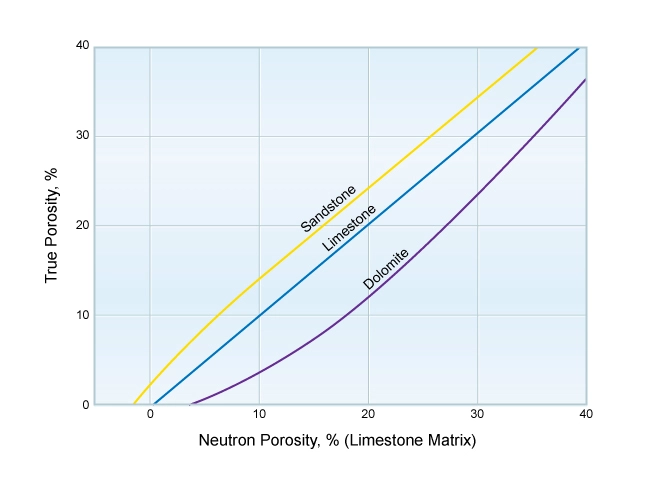
In most tools, the two source-detector spacings are chosen so that the ratio of the two count rates is relatively independent of the borehole environment. This ratio is then calibrated in terms of porosity in a known formation and borehole environment, typically with the neutron tool placed against the side of an 8-in. (20-cm) borehole in a limestone block filled with fresh water at surface temperature and pressure. The response is also determined at different porosities and in sandstones, dolomites and other borehole environments. Correction factors are developed to convert the measured log to the standard conditions. Charts (Figure 3) are published by each logging service company for correcting their tools’ neutron porosity log readings for the lithology, and these corrections are embedded in all petrophysical analysis computer programs.

chart for correcting neutron porosity log, Typical chart for correcting neutron porosity log readings for the lithology, neutron log, neutron porosity, porosity, Borehole Wireline, Wireline Logging, well logging, What is porosity in well logging, What is a porosity log, Porosity definition, Well logging porosity, Types of porosity, Porosity measurement, Porosity calculation, Porosity logs, Effective porosity, Formation porosity, Porosity analysis, Porosity interpretation, Porosity determination, Porosity evaluation, Porosity in reservoirs, Petrophysical porosity, Porosity logging tools, Porosity estimation, Porosity models, Porosity control, Porosity saturation, Porosity data, Porosity variations, Porosity distribution, Porosity zones, Porosity anomalies, Porosity characteristics
Figure 3: Typical chart for correcting neutron porosity log readings for the lithology

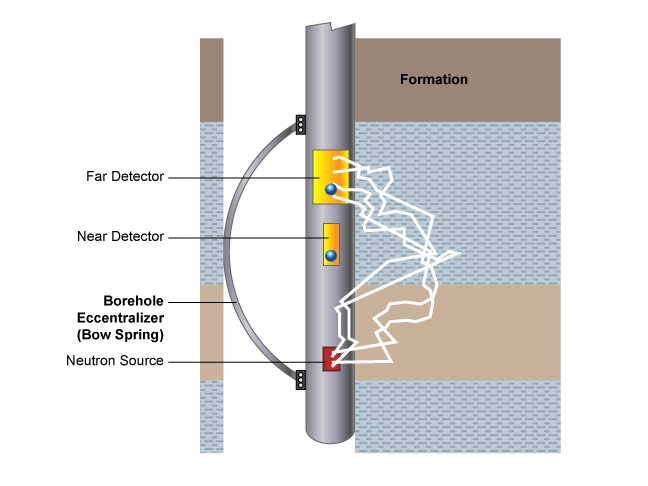
Wireline neutron porosity tools are normally run in the borehole eccentralized, often by the use of a bow spring (Figure 4) against the borehole wall. Because the neutrons emitted into the drilling mud are strongly attenuated, the resulting log is effectively focused into the formation.

Wireline neutron porosity tool eccentralized by the use of a bow spring, neutron tool, neutron porosity, porosity, Borehole Wireline, Wireline Logging, well logging, What is porosity in well logging, What is a porosity log, Porosity definition, Well logging porosity, Types of porosity, Porosity measurement, Porosity calculation, Porosity logs, Effective porosity, Formation porosity, Porosity analysis, Porosity interpretation, Porosity determination, Porosity evaluation, Porosity in reservoirs, Petrophysical porosity, Porosity logging tools, Porosity estimation, Porosity models, Porosity control, Porosity saturation, Porosity data, Porosity variations, Porosity distribution, Porosity zones, Porosity anomalies, Porosity characteristics
Figure 4: Wireline neutron porosity tool eccentralized by the use of a bow spring


A pad-mounted LWD neutron porosity tool is not possible, increasing the borehole effects. LWD neutron porosity tools will normally be unfocused because they are run centralized (Figure 5) within the wellbore. Source-to-detector spacings and porosity calculations are similar to wireline tools. The vertical resolution is about 2 ft (0.6 m) but may be improved by computer processing in some circumstances.

LWD tool run centralized in a wellbore close to the drill bit, porosity, neutron porosity, density log, neutron porosity log, Borehole Wireline, Wireline Logging, well logging, What is porosity in well logging, What is a porosity log, Porosity definition, Well logging porosity, Types of porosity, Porosity measurement, Porosity calculation, Porosity logs, Effective porosity, Formation porosity, Porosity analysis, Porosity interpretation, Porosity determination, Porosity evaluation, Porosity in reservoirs, Petrophysical porosity, Porosity logging tools, Porosity estimation, Porosity models, Porosity control, Porosity saturation, Porosity data, Porosity variations, Porosity distribution, Porosity zones, Porosity anomalies, Porosity characteristics
Figure 5: LWD tool run centralized in a wellbore close to the drill bit

Thermal and Epithermal Neutron Measurement for Porosity Analysis

The neutron porosity tool makes measurements based on the slowing down of neutrons between a source and two detectors. These detectors measure neutrons at the epithermal level, where their energy is above that of the surrounding matter, between approximately 0.4 and 10 eV. The detectors also measure neutrons at the thermal level, where they have about the same energy as the surrounding matter, typically less than 0.4 eV. When thermal neutrons are absorbed, gamma rays are emitted.

Ideally, a neutron porosity tool would count only the epithermal neutrons because the slower thermal neutron population depends as much on the absorption cross section of the formation as it does on the slowing-down length. However, to get count rates high enough for statistical accuracy, logging tools typically count all neutrons, both epithermal and thermal.

In summary, modern compensated neutron porosity logging tools make both thermal and epithermal neutron porosity measurements (Figure 6) to enable the calculation of the porosity and the identification of lithology, and to detect the presence of gas in the zone of the neutron porosity tool’s investigation (Figure 7).

Thermal and epithermal detectors on a neutron porosity tool, neutron porosity tool, porosity, Borehole Wireline, Wireline Logging, well logging, What is porosity in well logging, What is a porosity log, Porosity definition, Well logging porosity, Types of porosity, Porosity measurement, Porosity calculation, Porosity logs, Effective porosity, Formation porosity, Porosity analysis, Porosity interpretation, Porosity determination, Porosity evaluation, Porosity in reservoirs, Petrophysical porosity, Porosity logging tools, Porosity estimation, Porosity models, Porosity control, Porosity saturation, Porosity data, Porosity variations, Porosity distribution, Porosity zones, Porosity anomalies, Porosity characteristics
Figure 6: Thermal and epithermal detectors on a neutron porosity tool
The presence of gas detected on a neutron porosity log, neutron porosity log, porosity, Borehole Wireline, Wireline Logging, well logging, What is porosity in well logging, What is a porosity log, Porosity definition, Well logging porosity, Types of porosity, Porosity measurement, Porosity calculation, Porosity logs, Effective porosity, Formation porosity, Porosity analysis, Porosity interpretation, Porosity determination, Porosity evaluation, Porosity in reservoirs, Petrophysical porosity, Porosity logging tools, Porosity estimation, Porosity models, Porosity control, Porosity saturation, Porosity data, Porosity variations, Porosity distribution, Porosity zones, Porosity anomalies, Porosity characteristics
Figure 7: The presence of gas detected on a neutron log

The chemical source used in the neutron porosity tool bombards the formation with fast neutrons. The fast neutrons are slowed and then captured, primarily by the hydrogen atoms in the formation. The slowed neutrons deflected back to the tool are counted by the two detectors. The neutron count rates measured at the two detectors are used to compute a ratio related to the formation porosity that is much less affected by environmental factors than that of historical single detector neutron porosity logging tools.

In neutron porosity logging, the elastic collisions (Figure 8) between fast neutrons and the nuclei of hydrogen atoms are the predominant interaction through which fast neutrons lose energy before reaching epithermal or thermal energy levels.

Elastic collisions, neutron porosity, neutron porosity tool, neutron, Borehole Wireline, Wireline Logging, well logging, What is porosity in well logging, What is a porosity log, Porosity definition, Well logging porosity, Types of porosity, Porosity measurement, Porosity calculation, Porosity logs, Effective porosity, Formation porosity, Porosity analysis, Porosity interpretation, Porosity determination, Porosity evaluation, Porosity in reservoirs, Petrophysical porosity, Porosity logging tools, Porosity estimation, Porosity models, Porosity control, Porosity saturation, Porosity data, Porosity variations, Porosity distribution, Porosity zones, Porosity anomalies, Porosity characteristics
Figure 8: Elastic collisions

Much energy will be lost when the neutron collides elastically with the nucleus of a hydrogen atom, since the hydrogen nucleus has a mass equal to that of the neutron. The rate at which a formation slows down neutrons, therefore, is an indicator of the abundance of hydrogen. Because the compensated tool responds primarily to the hydrogen content of the formation, in clean formations the compensated neutron measurement reflects the amount of liquid-filled porosity.

Interpretation Challenges With Using the Neutron Porosity Tool Alone


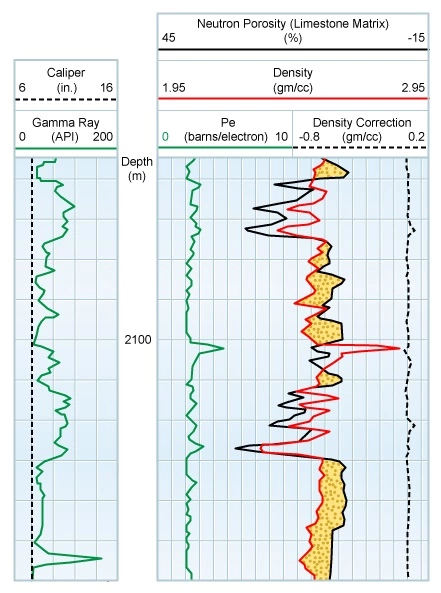
The neutron porosity tool provides a good direct estimation of a formation’s porosity whenever the formation is free of both shale and gas, as occurs over much of the shaded intervals in Figure 9, provided the formation is the same as the tool’s calibration (now often limestone matrix).

Gamma ray run in conjunction with a density-neutron log, porosity, porosity density, PHID, neutron porosity, neutron porosity tool, Borehole Wireline, Wireline Logging, well logging, What is porosity in well logging, What is a porosity log, Porosity definition, Well logging porosity, Types of porosity, Porosity measurement, Porosity calculation, Porosity logs, Effective porosity, Formation porosity, Porosity analysis, Porosity interpretation, Porosity determination, Porosity evaluation, Porosity in reservoirs, Petrophysical porosity, Porosity logging tools, Porosity estimation, Porosity models, Porosity control, Porosity saturation, Porosity data, Porosity variations, Porosity distribution, Porosity zones, Porosity anomalies, Porosity characteristics
Figure 9: Neutron porosity log in water-bearing section with mainly low shale content

However, this situation is the exception rather than the rule in many formations. The majority of wells contain some shale, at least over part of the logged section. In addition, the presence of light hydrocarbons requires skilled petrophysical interpretation. Consequently, the use of an interpretation technique which is not suitable for use in the presence of gas, such as using the neutron porosity log on its own, is unwise.

The presence of shale causes the neutron porosity reading to increase, often significantly, as shales always have a high hydrogen index, mainly due to the bound water which is always associated with shales. Neutron porosity readings in pure shale (Figure 10) often read in the range of 25 to 50 porosity units. When the shale volume can be estimated independently due to the acquisition of other logs, such as gamma ray, spontaneous potential (SP) or the deep resistivity in water-bearing zones, it is possible to attempt to make a proportionate correction for the shale content. However, the contribution of the shale to the neutron porosity readings normally dominates that from the porosity in the reservoir matrix. Consequently, unless the shale volume is precisely known, such a shale correction is unlikely to be very accurate.

Neutron porosity log in a section with multiple thick shale beds, Neutron porosity log, porosity, Borehole Wireline, Wireline Logging, well logging, What is porosity in well logging, What is a porosity log, Porosity definition, Well logging porosity, Types of porosity, Porosity measurement, Porosity calculation, Porosity logs, Effective porosity, Formation porosity, Porosity analysis, Porosity interpretation, Porosity determination, Porosity evaluation, Porosity in reservoirs, Petrophysical porosity, Porosity logging tools, Porosity estimation, Porosity models, Porosity control, Porosity saturation, Porosity data, Porosity variations, Porosity distribution, Porosity zones, Porosity anomalies, Porosity characteristics
Figure 10: Neutron porosity log in a section with multiple thick shale beds

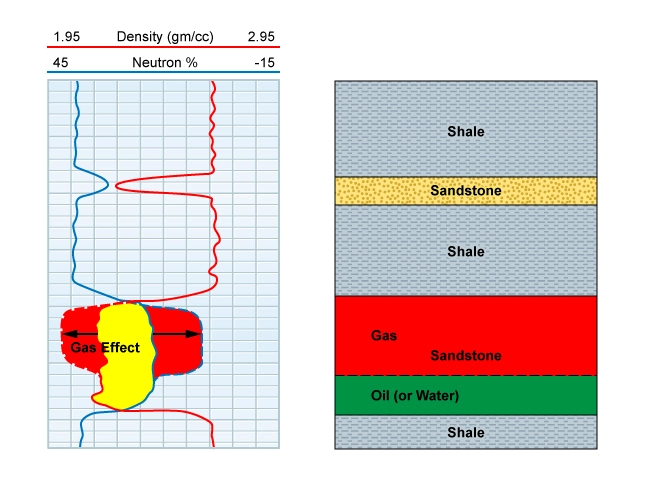
The presence of gas has a dramatic effect on the neutron porosity readings, which are greatly reduced by gas in the neutron tool’s zone of investigation. This results from the significantly lower hydrogen concentration in the gas than if the pore filling fluid were either water or oil. Although this makes the neutron tool an excellent gas indicator when used in conjunction with a density log, it correspondingly causes the neutron log, when used alone, to be invalid as a porosity indicator in the presence of gas.

As a result of these interpretation challenges in the presence of either shale or gas, using the neutron tool alone for porosity determination is not recommended. However, when used in combination with other logs, particularly the density log, the neutron log is valuable for many petrophysical interpretations, including porosity estimation.

Combinability With Other Porosity Logging Tools


Compensated neutron porosity tools are usually run simultaneously with other logging services in both LWD and wireline data acquisition modes. Density-neutron porosity crossplots are very useful for the identification of gas zones (Figure 11). On this log playback, the density log scale range from 1.95 gm/cc to 2.95 gm/cc combined with the neutron log scale range from 45% to -15% enables a quick visual detection of a thin gas interval from 2,610 to 2,618 m. The combination of the compensated neutron log and other porosity logs, especially the density log, results in more accurate porosity values and facilitates lithology identification, as well as the evaluation of, and correction for, the shale and gas content.

Density-neutron crossplot indicating a thin gas bearing interval, Borehole Wireline, Wireline Logging, well logging, What is porosity in well logging, What is a porosity log, Porosity definition, Well logging porosity, Types of porosity, Porosity measurement, Porosity calculation, Porosity logs, Effective porosity, Formation porosity, Porosity analysis, Porosity interpretation, Porosity determination, Porosity evaluation, Porosity in reservoirs, Petrophysical porosity, Porosity logging tools, Porosity estimation, Porosity models, Porosity control, Porosity saturation, Porosity data, Porosity variations, Porosity distribution, Porosity zones, Porosity anomalies, Porosity characteristics
Figure 11: Density-neutron crossplot indicating a thin gas bearing interval


Previous page 1 2 3 4 5 6 7 8 9Next page

Related Articles

Leave a Reply

Your email address will not be published. Required fields are marked *

ad
Back to top button