Model Calibration
We can use empirical measurements of vitrinite reflectance to constrain and determine the heat flow history and time/temperature relationships (Guidish et al., 1985). Lerche et al. (1984) extracted a time/temperature index (TTI) from measured vitrinite reflectance data, as a function of depth. We can use this TTI to calibrate heat flow histories determined from the geodynamic models. We use the heat flow histories to compute temperature as a function of time and depth. We compare this TTI to the TTI generated using Lerche et al.’s equations, solving for known vitrinite reflectance measurements at known depths. If the TTI predicted by the geodynamic model varies significantly from that computed by the empirically-based model, we can vary the geodynamic model parameters until we obtain a least-squares fit, or we can select a different geodynamic model altogether. Tissot et al. (1987) argue for using both theoretically and empirically based models to evaluate heat flow histories. Sweeney et al. (1990) present a computer program designed to optimize heat flow histories. This program computes vitrinite reflectance data based on kinetic and temperature history data, and compares computed values to calibrate the time/temperature relationship.
Maturation Modeling
Once we have calculated the time/temperature/depth relationships, our next step is to perform maturation modeling. There are several common approaches to maturation modeling, including; 1) an empirical approach proposed by Lopatin (1971) and modified by Waples (1980), and 2) a kinetic model proposed by Tissot and Espitalie (1975).
The empirical approach to maturation modeling is applied extensively because it calculates the combined effect of time and temperature based on the relatively simple assumption that rates of chemical reactions approximately double for every 10 degrees C rise in temperature. We plot a burial history curve using backstripped subsidence calculations, and plot paleotemperature on the burial history curve (Waples, 1980). Using this plot, we can determine the length of time any stratigraphic unit spends within a given 10 degrees C temperature interval, and the total number of intervals it has passed through in its history. We calculate the effects of increasing burial and temperature by multiplying the time in a given interval by successive powers of 2 (Table 1 [a]). We then sum the successive interval maturities to calculate a time-temperature index (TTI), which has been calibrated ( Table 1 [b] ) to vitrinite reflectance values (R0) and thermal alteration index (TAI) values. Bond (1988) details the principles and applications of the TTI method, complete with a detailed case history of maturation modeling in the Maracaibo Basin of Venezuela (Talukdar et al., 1986) and a hypothetical example of preparing a Lopatin model.
| Table 1: Lopatin relationships | ||
|---|---|---|
| a: Temperature factor to burial temperature. | ||
| Temperature Range (ºC) | Temperature-Factor ( | Temperature-Factor ( |
| 30-40 | ||
| 40-50 | ||
| 50-60 | ||
| 60-70 | ||
| 70-80 | ||
| 80-90 | ||
| 90-100 | ||
| 100-110 | 1 | |
| 110-120 | 2 | |
| 120-130 | 4 | |
| 130-140 | 8 | |
| 140-150 | 16 | |
| 150-160 | 32 | |
| 160-170 | 64 | |
| b.) Cumulative TTI values to other geochemical parameters. | ||
| % Vitrinite Reflectance ( | Thermal Alteration Index (TAI) | Generation |
| 0.04 | 2.25 | <1 Condensate from resinite ___________ |
| 0.50 | 2.50 | from S-rich kerogen |
| 0.60 | 2.60 | | |
| 0.65 | 2.65 | | |
| 0.70 | 2.70 | | |
| 0.80 | 2.8 | Oil |
| 0.90 | 2.87 | | |
| 1.00 | 2.90 | | |
| 1.15 | 3.00 | ______________ |
| 1.35 | 3.27 | Wet gas |
| 1.50 | 3.50 | ______________ |
| 1.75 | 3.60 | Dry gas |
| 2.00 | 3.70 | |
| 2.50 | 3.80 | |
| 3.00 | 3.90 | |
| 4.00 | 4.00 | |
| 5.00 | 4.00 | |
Waples (1980) summarizes the applications of TTI modeling to exploration. First, we can use the data to predict present-day TTI values for potential reservoirs. For example, if the TTI value for a reservoir at 12,000 ft (3,758 m) is 1,200, the reservoir will contain dry gas according to Table 1 (b). Second, we can calculate present-day values for a known organic-rich shale at several points within a basin (Figure 1).
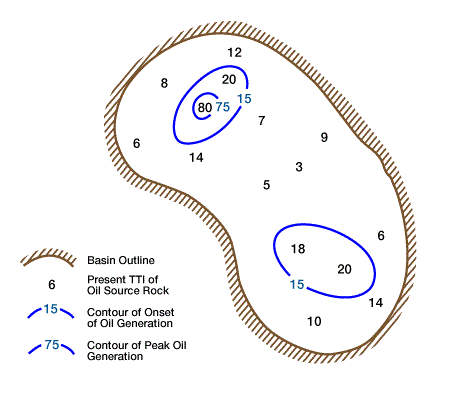
We can contour these values to determine the extent and location of potentially mature source rock. In this example, only limited areas have reached mature levels. A third application answers questions about timing of maturation. The model in Figure 2 shows a window defined by connecting TTI values of 15 and 160 on each of several horizons.
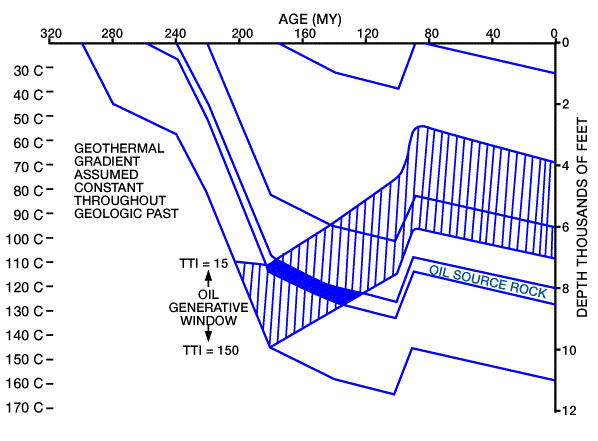
This oil window shows that the oil source rocks began generating 180 Mya, and ceased generating 120 Mya. If traps in the region did not form until 100 to 90 Mya, oil migration would have occurred prior to their formation. If we next plot the gas window, we can make similar predictions about potential gas traps.
The ease of application and limited data requirements of the Lopatin method make it an attractive first-pass method of maturation modeling (Bond, 1988). There are many computer programs on the market for developing Lopatin plots, and these plots are frequently provided as part of routine commercial geological/geochemical analyses. There are, however, several caveats to the application of Lopatin modeling (Tissot et al., 1987). The TTI model relies on the assumption that reaction rates double for every rise of 10 degrees C in temperature. This assumption is valid only within a limited range of activation energies near the onset of oil generation. At advanced stages of oil and gas generation, activation energies necessary to affect kerogen maturation are much higher, and reaction rates are multiplied by factors of 5 to 10 for each 10 degrees C rise (Tissot and Espitalie, 1975). Additionally, Lopatin’s model considers that all types of kerogen react similarly during thermal maturation. This assumption is invalid, as recognized by many authors (Tissot and Welte, 1984). Several published studies highlight shortcomings of the Lopatin method. Tissot et al. (1987) point out that kinetic models provide better agreement with known distributions of oil and gas in sedimentary basins. They recommend applying Lopatin modeling only when the computer facilities necessary for kinetic modeling are not available.
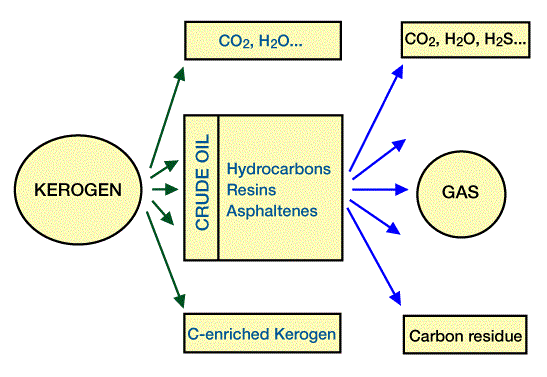
Kinetic models of organic matter maturation directly calculate the amount of oil and gas generated from kerogen in sediments, where we know TOC, kerogen types, and thermal history (Figure 3).
Kinetic modeling using the Tissot-Espitalie method calculates a transformation ratio for bitumen which is a measure of maturity. A ratio of 0:1 equals 0 percent, or immature, with all generation potential remaining. At a ratio of 1:1, (100 percent, over-mature), all generation potential has been realized (Bond, 1988). Figure 4, Figure 5, and Figure 6 show transformation ratios (as percentage conversion) for three types of kerogen.
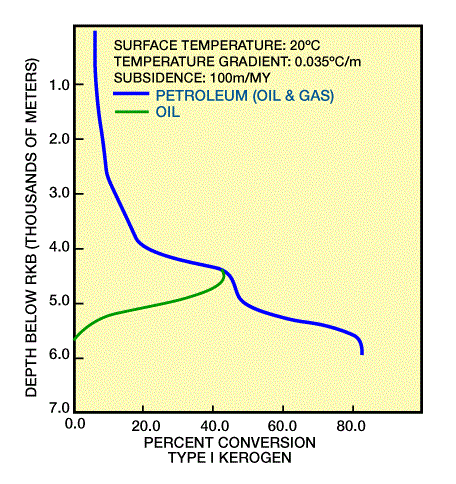
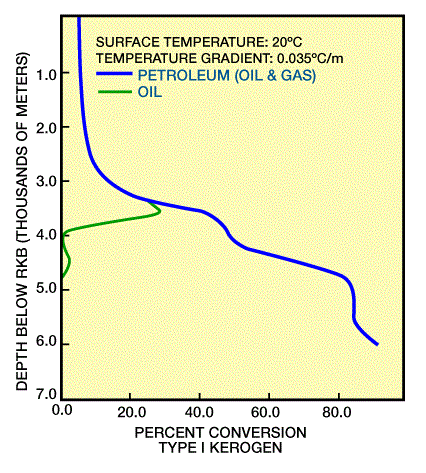
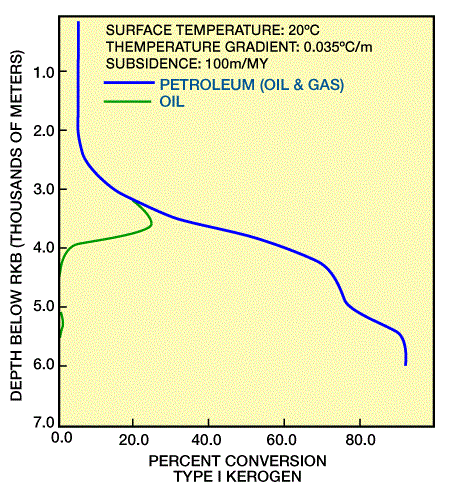
Kinetic modeling is both mathematically and computer intensive (Tissot and Espitalie, 1975; Ungerer et al., 1984), taking into account several parallel reactions, with varying activation energies and reaction rates as determined in the laboratory for different types of kerogen. These models, however, allow for more realistic analysis and prediction of maturation than do non-kinetic models.
Figure 7 compares the evolution of transformation ratios (maturation) for four different kerogen types subjected to the same thermal history.
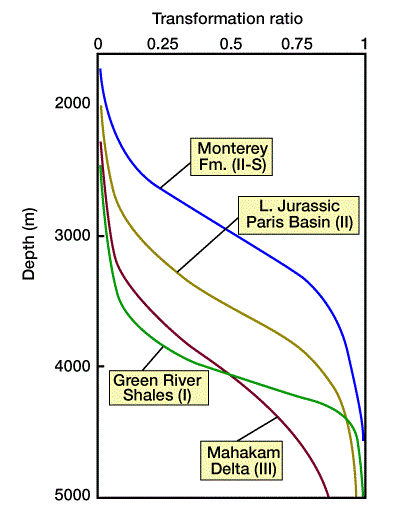
Maturation of Type II, high-sulfur kerogen in the Monterey Formation begins at a shallow depth, while maturation of Type II kerogen in the Paris Basin begins slightly deeper. Both generate over a broad depth range. Type III kerogen in the Mahakam delta matures at a greater depth and temperature than does Type II kerogen, and the transformation ratio increases slowly due to complex activation energies. Type I kerogen in the Green River shales matures quickly, at greater depths, because of relatively simple kerogen chemistry. Figure 8 shows even more striking differences between the generation potential of the different kerogen types.
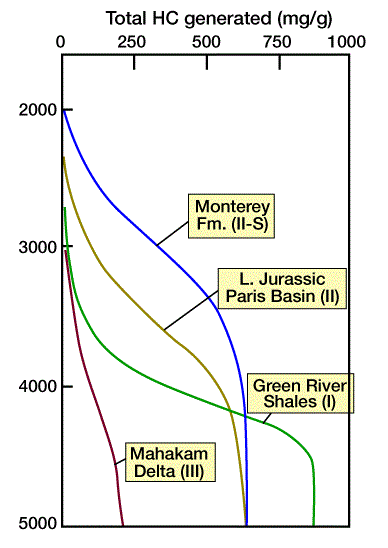
Kinetic models compute burial and hydrocarbon generation histories, and provide quantitative assessment of hydrocarbon potential in sedimentary basins.
Kinetic models for analyzing oil and gas generation are now recognized as an integral part of basin modeling. Computer programs (e.g., BasinModTM) are available for personal computers. These programs require input in the form of burial and thermal histories, based on known geological and geophysical data and on model calculations. It is important to constrain the model by comparing measured maturation indices, present-day heat flow, and thermal conductivity measurements (Waples et al., 1992a, 1992b).
Migration Modeling
We apply quantitative migration modeling at more advance stages of exploration, when richness and distribution of source rocks are fairly well known from well data. These data allow us to quantify the amount of hydrocarbons generated in the basin, and to model the migration, accumulation, and leakage of hydrocarbons (Ungerer et al., 1984). The migration model proposed by these authors uses input from previous thermal modeling and backstripping calculations. They compute compaction effects and create cross sections that show pressure and hydrocarbon saturation within sediments through time.
Thermodynamic Modeling
Thermodynamic modeling is specifically designed to determine the amount and composition of hydrocarbons that may migrate within a gaseous solution. Therefore we can use a thermodynamic model to predict the condensate content of wet gases, which is important at depths and pressures where the oil/gas mixture separates into two phases. Successively lighter oils condense out of the gas phase at successively shallower depths and pressures. The model predicts the pressure at which condensation of oil begins Figure 1, Evolution of the composition of oil and gas phases during vertical migration, as computed by the thermodynamic model.
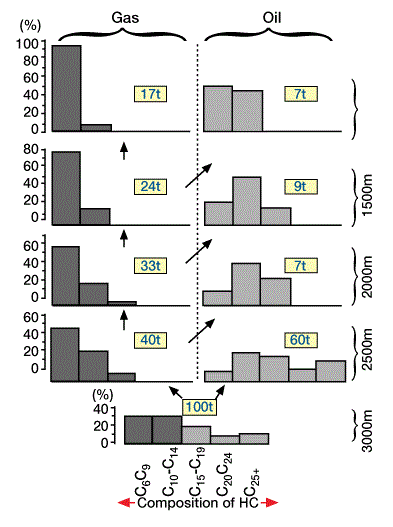
Initial composition is based on deep condensates of the Mahakan delta in the high pressure zones.) and computes the changing composition of the oil/gas phases during vertical migration. We should use this model relatively late in an exploration program to answer specific questions about contents of gas condensate and vertical migration.
 Petro Shine The Place for Oil and Gas Professionals.


