Related Articles


Backstripping Models
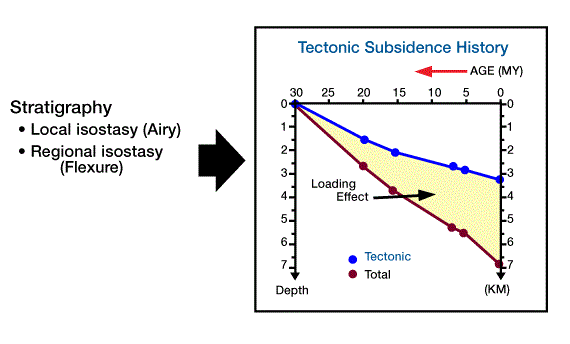
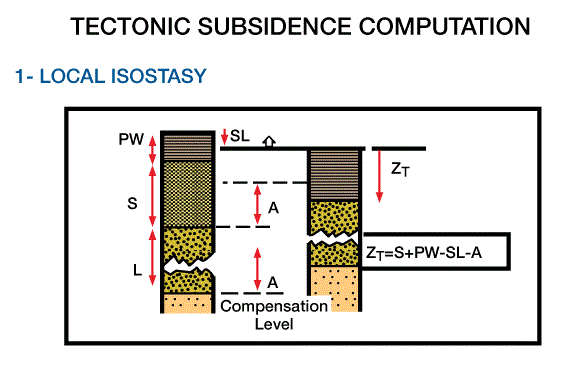
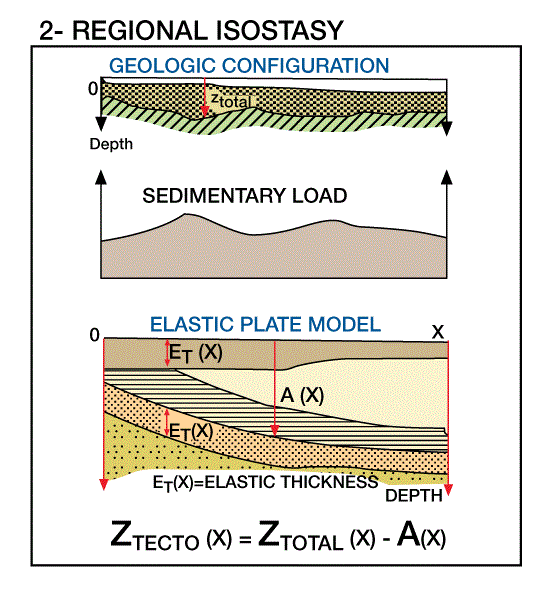
We use backstripping models to reconstruct the evolution of basin subsidence and sediment infill, with the goal of determining tectonic subsidence by removing the effects of sediment and water loading on the lithosphere. We do this by considering compaction effects on the sediment fill through time, as well as paleobathymetry. We can factor eustatic sea level variations into the model where such data are available. In order to compute tectonic subsidence, we must determine the response of the crust to loading by sediments and water. We do this by applying models that describe the behavior of the lithosphere when loaded. The simplest model (local or Airy isostasy) assumes that the lithosphere has no strength; this model fails to reflect the measured behavior of the lithosphere. A more realistic model (flexural isostasy) assumes the lithosphere behaves as a rigid plate overlying a fluid asthenosphere. Watts et al. (1975) determined that flexural rigidity may increase through time, depending on the thermal time/depth relationships. Karner et al. (1983) concluded that continental lithosphere responds similarly. Ungerer et al. (1985) used estimated values of elastic thickness (a measure of flexural rigidity) to compute the local and flexural isostasy models used for tectonic subsidence computations. In addition to computing tectonic subsidence (Figure 1 and Figure 2), the model of Ungerer et al. (1984)
reconstructs the geometry of the sedimentary basin through time in the form of successive cross sections Figure 3
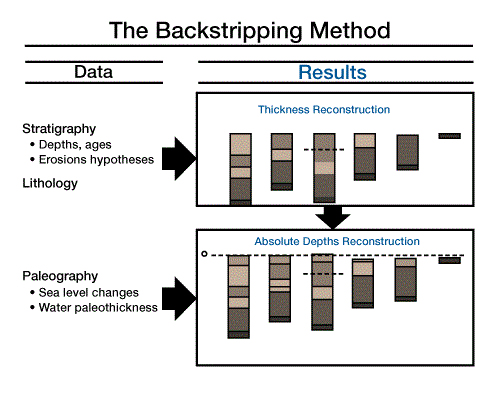
and Figure 4).