Related Articles


Low Resistivity Logging Tools Case Studies
Evaluation of Low Resistivity Pay using Multi-component Induction Logs
The following case study describes a low resistivity pay zone that was logged using the Baker Hughes 3D ExplorerTM Multi-component Induction Logging tool. A detailed discussion of this well log can be found in the original paper by Munholm et al. (2002).
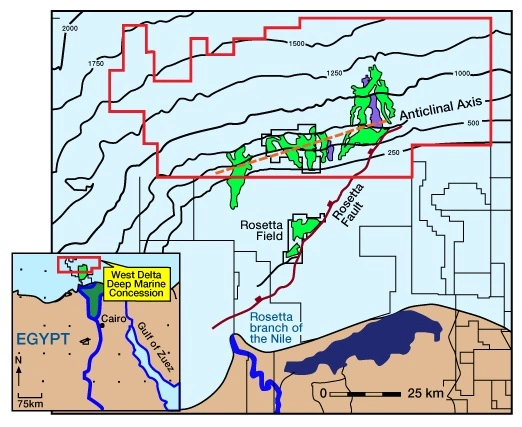
Several exploration and appraisal wells had been drilled in the West Delta Deep Marine (WDDM) concession, offshore from Egypt’s Nile River delta (Figure 1).
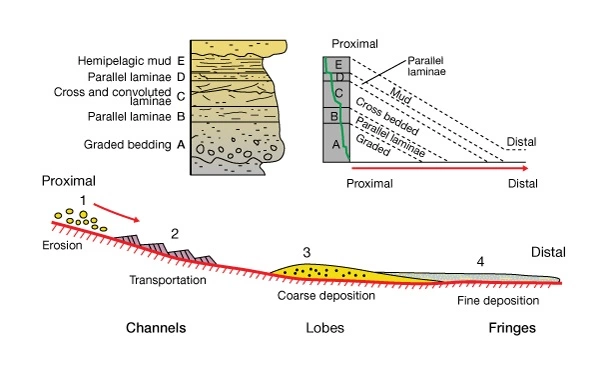
These wells were notorious for their low resistivity pays found in upper Pliocene age slope channel complex reservoirs, which are comprised of a mixture of deep marine channel and overbank facies. The channel fills are highly heterogeneous and are a mixture of turbidites (Figure 2), slides, slumps and debris flows. The lithology varies from clean, unconsolidated sandstones and conglomerates to finely laminated sandstones, siltstones and mudstones. The overbank facies are typical channel levee deposits.
Dual packer formation tester and drill stem test (Figure 3) data proved that many of the fine grained, laminated sections contain economic pay zones.
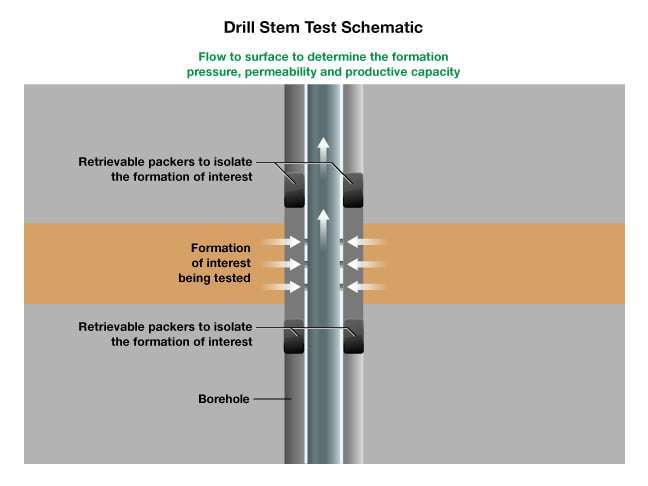
One drill stem test flowed gas at over 23 mmscf/d from a finely laminated, 17-metre-thick interval. While these laminated sections make up substantial volumes of the channel fill and overbank sections, they are difficult to quantify using conventional petrophysical logs.
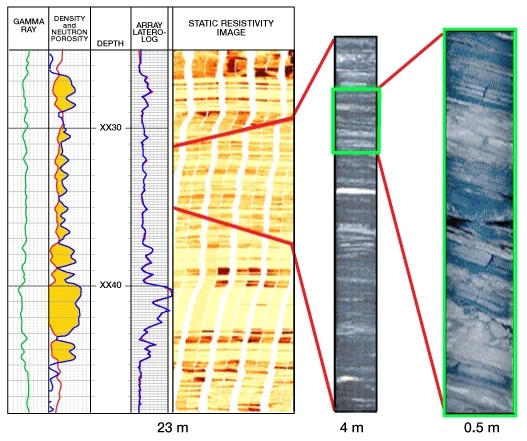
Figure 4 displays a composite log showing the gamma ray, density, neutron porosity, array laterolog and resistivity image logs. While pay is quite clearly evident in the zone between XX37 and XX45 meters, the zone from XX29 to XX37 meters is ambiguous. Although the neutron porosity and density curves exhibit the gas crossover effect throughout this upper interval, the resistivity curves of the array laterolog cannot vertically resolve the resistivities of the individual sandstone laminae. Detailed analysis of a 0.5-meter segment of full diameter core reveals individual laminations of only a few centimeters thickness, which are well below the vertical resolution of conventional resistivity devices. The array laterolog records resistivities of 1 to 3 ohm-m through this interval, resulting in uncertain fluid saturation estimates.
The operator of this well decided to analyze this zone further, using the Baker Hughes 3D ExplorerTM tool. The composite log (Figure 5) shows the following curves:
- Track 1: Gamma Ray (0 – 100 gAPI) and Caliper (4-14 in).
- Track 2: Bulk Density (1.7-2.7 gm/cc) and Compensated Neutron (60-0 porosity units).
- Track 3: Depth (meters).
- Track 4: HDIL Array Resistivity (2ft vertical resolution) matched with 3DEX derived resistivity of the sand fraction (0.2 to 200 ohm-m).
- Track 5: 3DEX Rh and Rv and HDIL 4ft, 90-inch (0.2-200 ohm-m).
- Track 6: Shale volume from Thomas-Stieber and Tensor calculations (0-100%).
- Track 7: Total porosity for the sand fraction and total porosity for the entire formation, PORT (50 – 0 porosity units).
- Track 8: Total water saturation of the formation, and total water saturation of the sand fraction (100 – 0%)
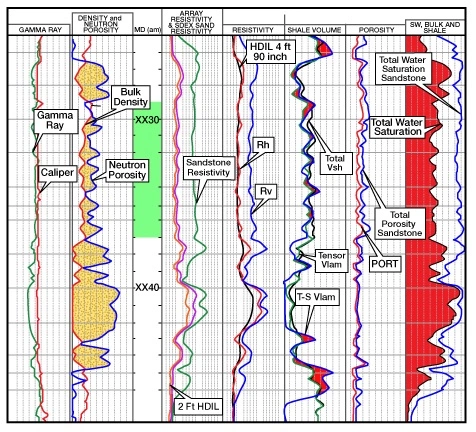
In the laminated intervals, the log shows that resistivity of the sand fraction is significantly higher than Rh. In Track 5, the agreement between HDIL and Rh reinforces the fact that while the HDIL tool obtains high resolution measurements, it measures the horizontal resistivity. The track on the far right shows that the water saturations derived for the sandstone intervals of the formation are around the 10% level. On the interpretation of the 3DEX data, the operator of this well was able to complete a zone for hydrocarbon production that had previously been in question.
Integration of Nuclear Magnetic Resonance Data
Integrating nuclear magnetic resonance (NMR) data with the other log measurements, can improve the petrophysical analysis of shaly sandstones. Integration of these data enables the determination of several important reservoir properties that had previously been quite challenging in the absence of full diameter core data, such as:
- Permeability
- Shale volume and distribution
- Clay bound water volume
- Irreducible water saturation
- Qv, the clay conductivity
- Mineralogically independent total and effective porosities
This case study describes how NMR measurements have been integrated with conventional logging measurements to evaluate the porosity and permeability in a laminated sandstone and shale interval. A detailed discussion of this log can be found in the paper by Ostroff et al. (1999).
In laminated shaly sandstone sequences where the thickness of the individual laminations is smaller than the vertical resolution of the logging tool, the porosity values for individual laminations will not be adequately resolved. Consequently, the log porosity represents the partial volume-weighted summations of the sandstone and shale porosity values integrated over the vertical measurement resolution of the logging tool as follows:


In these equations, the laminar shale volume is computed using the NMR tool’s shale distribution model. Figure 6 illustrates NMR tool response in a laminated sandstone and shale sequence.
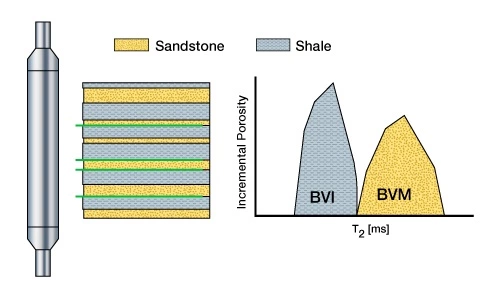
After the laminar shale volume is quantified, the pore volumetrics of the sand laminations can be derived as follows:


In thin bedded, laminar sandstone and shale sequences, the NMR-derived “bulk” permeability that is computed from the “bulk” NMR porosity data might be much too low when compared with the true permeability of actual sandstone laminations. If the above reconstructed sandstone lamination pore volumes are substituted into the Coates-Timur model, a reconstruction of the sand lamination permeability can also be made, as shown below.
Coates-Timur Model

The model uses the NMR derived porosity and the ratio of free fluid to bound fluid to compute the permeability. Default values for model parameters are C=10, a=4, and b=2.
Log Results
The log example in Figure 7 shows the computed “bulk” permeabilities and the reconstructed sandstone lamination permeabilities for a highly laminated progradational sandstone and shale sequence from the Gulf of Mexico.

The combined NMR and resistivity-based saturation petrophysical analysis indicates that the entire sequence is at irreducible water saturation. The reconstructed sandstone lamination permeability derived from the models correctly predicts the high productivity observed from the completion across the very highly laminated lower interval. The original completion of the upper interval produced hydrocarbons free of water at 800 BOPD. The additional completion of the lower interval added another 733 BOPD of water-free production.
