Related Articles


Learning Objectives
After completing this topic “Log Analysis of Low Resistivity and Low Contrast Pays“, you will be able to:
- Be conversant with the key parameters used in the petrophysical interpretation of low resistivity, laminated shaly sandstones.
- Describe the main methodologies and equations used in low resistivity shaly sandstone log analysis.
By completing this topic and then applying the learnings in your job, you will be able to attain Basic Application Competence Level in low resistivity and low contrast pay well log interpretation.
The Archie Equation
In 1952, Gus Archie published his seminal water saturation equation to show how formation resistivity was related to the fluid resistivity, the fluid saturation, and the porosity of the rock. Many more sophisticated, complex log interpretation models have since evolved from this basic equation, which is still used today in evaluating conventional hydrocarbon resources in thick, clean reservoirs.
Most oil and gas fields are not entirely comprised of thick and shale-free reservoirs (where the basic Archie equation applies to calculating water saturation) so the log analyst is usually faced with evaluating more complex reservoirs. When the basic Archie water saturation model is applied to well logs from thin and finely laminated shaly sandstones, the water saturation calculations tend to be more pessimistic than subsequent production data would indicate.
In this review of the Archie equation, key input parameters and their impact on the water saturation, Sw, calculations are described. Also discussed is how changing these parameters can affect the outcome of the water saturation, Sw, estimation and why logging while drilling (LWD) and wireline well logs must always be carefully and rigorously related to the full diameter, and sidewall, core analysis data.
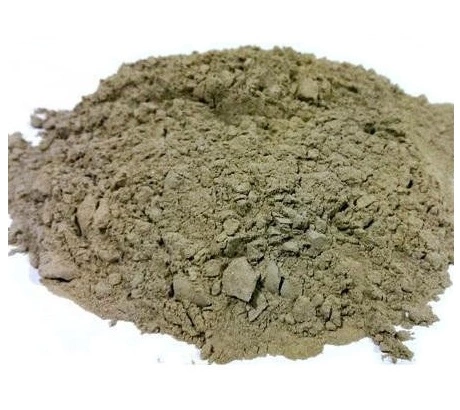
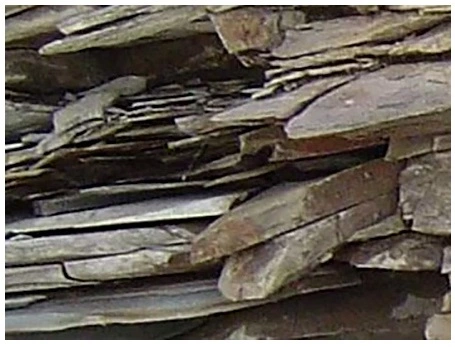
Note that some authors tend to use the terms clay and shale almost interchangeably, but there are subtle differences between them. Clay (Figure 1) is a fine-grained rock that combines one or more clay minerals with traces of metal oxides and organic matter. Clays are plastic due to their water content and become hard, brittle and non–plastic upon drying. Shale (Figure 2) is a fine grained, fissile, detrital sedimentary rock formed by the consolidation of clay and silt-sized particles into thin, relatively impermeable layers.
Key Parameters
The parameters of the Archie equation are the formation factor, F, the tortuosity factor, a, the cementation exponent, m, and the saturation exponent, n.
Formation Factor, F
Archie combined three measurable observations into one equation. By successively saturating a rock sample with solutions of different salinities, he found that the resistivity of the water-saturated rock, Ro, related to the resistivity of the saturating formation water, Rw, through the relationship:

The formation factor is correlated to the formation porosity by the relationship:

Where:
a is a constant, termed the tortuosity factor. Tortuosity relates to the complex path by which the fluid must travel through a permeable rock matrix.
m is termed the cementation exponent, whose value varies with the grain size, the grain size distribution and the tortuosity of the rock.
Some typical values for the parameters a and m are summarized in Table 1.
| Tortuosity Factor a | Cementation Exponent m | General Application |
|---|---|---|
| 1.0 | 2.0 | Carbonates |
| 0.81 | 2.0 | Consolidated Sandstones |
| 0.62 | 2.15 | Unconsolidated Sands |
| 1.45 | 1.54 | Average Sands |
| 1.65 | 1.33 | Shaly Sands |
| 1.45 | 1.70 | Calcareous Sands |
| 0.85 | 2.14 | Carbonates |
| 2.45 | 1.08 | Pliocene Sands |
| 1.97 | 1.29 | Miocene Sands |
| 1.0 | 2.05 – ϕ | Clean Granular Formations |
The water saturation in clean, thick reservoirs can be calculated using the basic Archie equation:

Where:
Sw is the water saturation
n is the saturation exponent
Ro is the resistivity of the formation at 100% water saturation
Rt is the true formation resistivity
By substituting Ro into the above equation, the following water saturation equation results:

Where:
F is the formation factor
Rw is the formation water resistivity
m is the cementation exponent
a is the tortuosity factor
Parameters a, m and n
Some interpretation petrophysicists initially set the values of the parameters a, m and n to 1, 1.9 and 2, respectively, when they are unknown. However, for rigorous petrophysical analysis, the values of a, m and n should always be determined by special core analysis of the specific reservoir formation being evaluated.
Some other frequently used values for these three parameters are:
For sandstones:
a = 0.81, m = 2, n = 2 (Frequently used in many basins around the world until the petrophysical parameters have been established through core analysis.)
or
a = 0.62, m = 2.15, n = 2 (Preferred by many well log analysts working in the U.S. Gulf Coast.)
For carbonates:
a = 1, m = 2, n = 2 (Used initially by a majority of petrophysicists while awaiting the SCAL core analysis data, which can take six months to complete.)
Consequently, following are three commonly used versions of the Archie equation.
For sandstones:

or:

For carbonates:

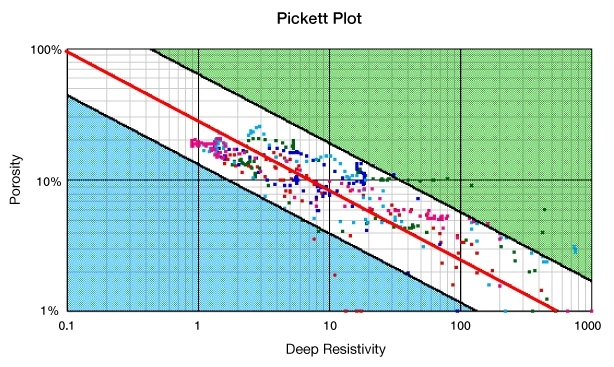
Crossplot methods, such as the Pickett plot (Figure 3), can allow each of these parameters to be estimated one at a time from well log data. However, there is no substitute for full diameter special core analysis to establish the precise parameter values for each reservoir unit. Doveton (2001) provides a good perspective on the Archie equation and the evolution of the a, m and n parameter values.
Determining the Value of the Saturation Exponent, n
While the saturation exponent, n, is usually assumed initially to be 2, its exact value may vary depending on the rock’s wettability. Oil wet formations often have an n value greater than 2, while certain water wet systems may have an n parameter of less than 2. To determine the saturation exponent, a core sample is prepared at several different water saturations and the ratio of Ro to Rt is measured for each saturation. By taking the logarithm of the Archie equation, it is transposed into:

Therefore, a plot of log(Sw) versus log(Ro/Rt) should produce a straight line of slope n (Figure 4).
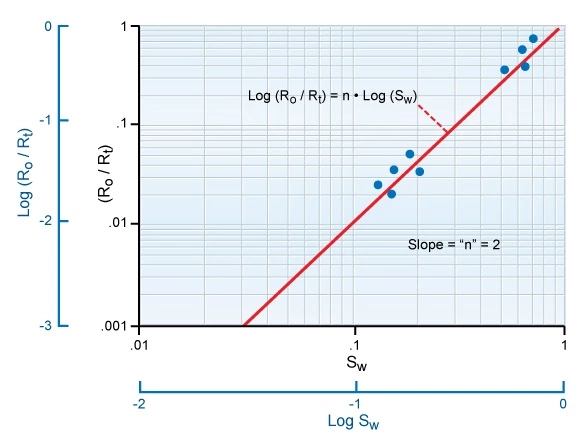
It is worthwhile to explore the sensitivity of the calculated water saturation to the value of n used. An initial calculation of the water saturation is made using the parameter n = 2 and the resulting value of the water saturation is 0.5, or 50%.
If n is increased to 2.2, then:

If n is decreased to 1.7, then:
 or
or 
To summarize, if all other factors remain the same, raising the value of n used in the calculation raises the water saturation; lowering the value of n, lowers the calculated water saturation.
Determining the Value of the Cementation Exponent, m
Each formation has its own distinctive formation factor-to-porosity relationship. Measurements to determine this relationship require a range of core samples covering different porosities. At each porosity, a measurement is made of Ro, the resistivity of the rock at 100% water saturation. If the value of the formation water resistivity, Rw, is known, the formation factor, F, can be calculated by using the equation:

The solution used to saturate the core should be of the same salinity as the formation water.
Taking the logarithm of both sides of the equation that relates formation factor to porosity:

A plot of log(F) versus log(ϕ) should give a line of slope, -m, and an intercept, a, that is found at 100% porosity, or 1 in decimal notation (Figure 5).
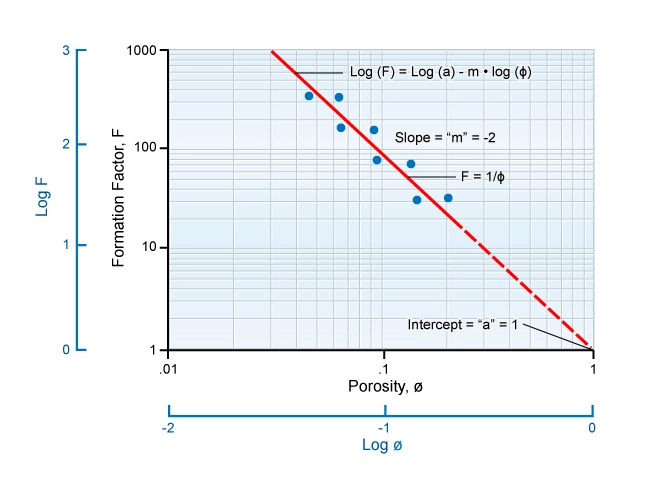
The calculation of water saturation is very sensitive to the value of the cementation factor, m; use of an incorrect m value tends to generate significant water saturation errors.
Relating the Parameters, a, m, and n to Water Saturation Calculations
Figure 6 illustrates the influences that the input parameters a, m, and n and the porosity exert on calculations of the formation factor and the water saturation. The table is divided into three different porosity sections and shows the formation factor, F, and water saturation, Sw, for different combinations of the parameters a, m and n. By holding certain parameters constant, we can see how the other variable affects the calculation. Thus, if we hold n constant at 2.5, the porosity constant at 20%, the tortuosity factor, a, at 0.81, then we can see that by changing m from 2.00 to 2.15, we will cause the water saturation, Sw, to change from 0.46 to 0.50, or from 46% to 50%.
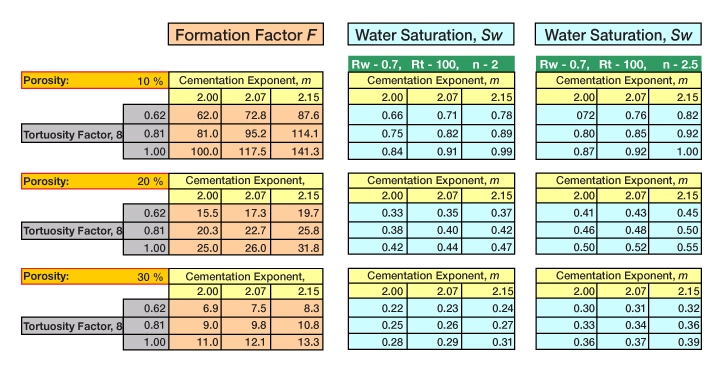
From Figure 6, we may conclude that if all other variables are held constant, then:
- By raising the porosity, the value of F decreases, as does the water saturation.
- By raising the value of a, the value of F increases, as does the water saturation.
- By raising the value of m, the value of F increases, as does the water saturation.
- By raising the value of n, the value of F increases, as does the water saturation.
This emphasizes the importance of integrating log analysis with the various petrophysical input parameters, a, m, and n, derived from special core analysis.
