Related Articles


Shaly Sandstone Interpretation
Effect of Clays and Shales on the Calculated Water Saturations
The petrophysicist faces some significant problems when interpreting well logs acquired in shaly formations. In situations where an adequate petrophysical model does not exist or the fundamental electrical behavior of the rock system is not well understood, porosity, hydrocarbon content and fluid production predictions must be established from the analysis of LWD and/or wireline well logs, together with any other available data.
Log interpretation complications arise whenever clay material is present with a quartz matrix sandstone, and especially where the formation waters are fresh, in which case conventional log analysis overestimates the water saturation. Interpretation is also challenging when formation waters have high salinity and abnormally low formation resistivities are observed in pay zones. Both situations can lead to bypassed hydrocarbon production, unless adequate steps are taken to identify these potentially hydrocarbon productive zones.
The basic Archie relationship, generated for clean formations, is not valid under the conditions encountered in shaly sandstones. Here, the hypothesis that Co, the wet rock conductivity, is always linearly related to Cw, the water conductivity, is found to be false. Figure 1 illustrates that as the formation water conductivity increases, Co increases through a non-linear zone until it reaches a plateau at some conductivity offset, X, above the clean sandstone line.

The form of the Cw versus  relationship is a function of the shaliness of the sandstone. Figure 2 shows that the apparent formation factor,
  , decreases as the shale content increases.

At high values of Cw in salty formation waters, Fa approaches the classical Archie formation factor. An explanation is, therefore, sought for the source of the “excess” conductivity, X. In general, the approach first models the behavior of the 100% water-bearing shaly sandstone system, and then modifies the model to include non-conductive hydrocarbons.
Clay Distribution and Type
In studies of shaly sandstones, a distinction is often made between the terms clay and shale. In this subtopic, the terms clay or dry clay are used to refer to dehydrated shale, and shale refers to rehydrated dry clay materials.
Shale effects primarily depend on the:
- Distribution of the clay material
- Type of the clay material
- Amount of clay material in the formation
- Water salinity
- Water saturation
Figure 3 illustrates three different distribution models in which clay and shale materials may be found within a sandstone formation.

All these forms of shale can, in some cases, occur simultaneously within the same formation.
Clay Types
There are two methods of defining shales: describing their grain size and describing their mineral content.
The standard definitions for lithologies based on the grain size diameter are:
- Sand: 0.05 to 2 mm, or 50 to 2,000 microns
- Silt: 0.004 to 0.05 mm, or 4 to 50 microns
- Clay: less than 0.004 mm, or less than 4 microns
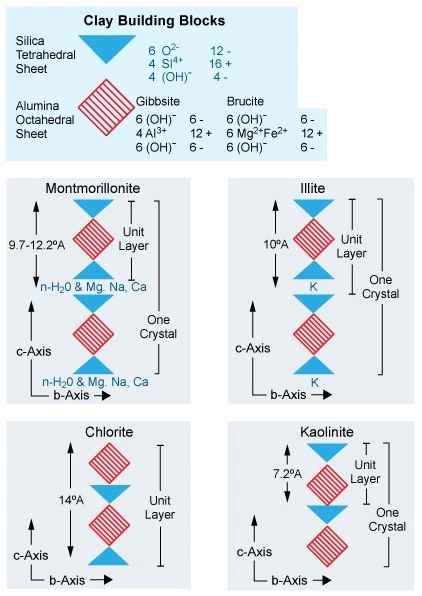
Mineralogical analysis establishes the most common clay minerals as montmorillonite, smectite, illite, kaolinite and chlorite. These are various molecular arrangements of alumino-silicates with variable quantities of quartz and feldspar.
These clays can be further subclassified by their mode of origin. Detrital clays are deposited with the sandstone at the time that the sediments are deposited. Authigenic clays form as precipitates from solution at a later time. A schematic of the molecular building blocks and their various arrangements to form clay crystals is shown in Figure 4.
The most important petrophysical characteristic of these minerals is their ability to hold adsorbed water on their grain surfaces. Table 1 documents the surface areas of some common minerals.
| Table 1: Surface Areas of Common Minerals | ||
|---|---|---|
| Formation | m2/cc | Acres/cu.ft |
| Montmorillonite | 900 | 6,300 |
| Illite | 280 | 1,960 |
| Kaolinite | 50 | 350 |
| Sands (100 grains) | 0.1 and 0.2 | |
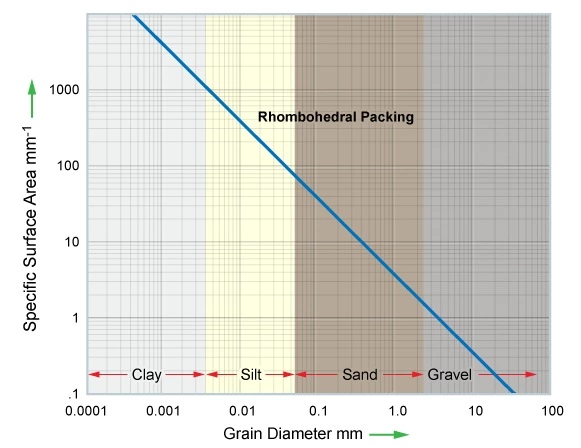
Figure 5 establishes the general relationship between grain size and grain surface area, assuming rhombohedral packing.
The basic Archie water saturation equation, relating the rock resistivity to the water saturation, assumes that the formation water is the only electrically conductive material in the formation. The presence of shale as another conductive material requires either that the Archie equation be modified to accommodate the existence of the shale, or that a new petrophysical model be developed to relate the rock resistivity to water saturation in shaly formations.
The presence of clay also complicates the definition of rock porosity. Although the layer of bound water on the clay particle can represent a significant amount of porosity, this non-effective porosity is not available as a potential reservoir for hydrocarbons. Thus, a shale or shaly formation may exhibit a fairly high total porosity yet a much lower effective porosity as a potential conventional resource hydrocarbon reservoir.
Microporosity
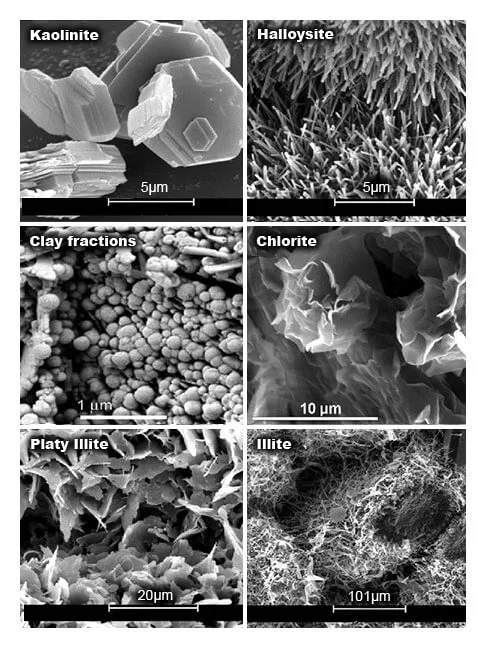
As the grain diameter decreases, so does the pore throat radius. This decrease, accompanied by an increase in the capillary pressure, increases the amount of water that can be imbibed into the system. When fine-grained silt- and clay-sized particles are present, microporosity (consisting of pores with diameters less than 2 nm) accounts for a large percentage of the total porosity. Under these circumstances, the irreducible water saturation can be very high.
A visual understanding of where and how the micropore system develops is illustrated in Figure 6, which shows scanning electron microscope (SEM) photographs of some major clay types.
Cation Exchange Capacity
Crystal surfaces have cation exchange sites, where ions can temporally reside as the result of the charge imbalance on the external surface of the clay’s molecular building blocks. These exchange sites effectively offer an electrical path through the clay by means of surface conductance. Dry clay is an insulator; wet clay is a conductor. To quantify the conductivity of wet clays, the cation exchange capacity (CEC) can be measured in a laboratory, ideally from a full diameter core. In general, the larger the specific surface area, then the larger the CEC is. The clay type itself is not significant, only its specific surface area. Figure 7 shows the relationship between CEC and the specific surface area.
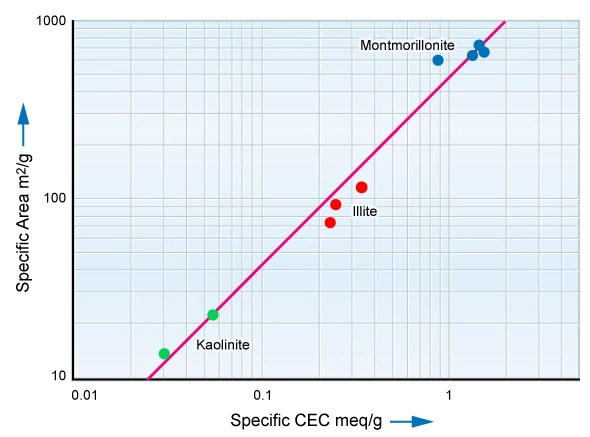
Chlorite, a common clay mineral, may not follow the trend shown in Figure 7 quite as well as the other clay minerals. Even quartz sand grains, if sufficiently small, exhibit surface conductance and can be ascribed a very small CEC value.
Unfortunately, there are no LWD or wireline log measurements which enable a direct measurement of either the cation exchange capacity or the specific surface area. Core material is essential for establishing these critical data.Table 2 documents the properties of, and log responses to, some common clay minerals.
| Table 2: Properties of, and Log Responses to, Common Clay Minerals | ||||
|---|---|---|---|---|
| Chlorite | Kaolinite | Illite | Montmorillonite | |
| ρma gm/cc | 2.6-2.96 | 2.6-2.7 | 2.6-2.9 | 2.2-2.7 |
| ρma av | 2.79 | 2.63 | 2.65 | 2.53 |
| CEC meq/100 g | 10-40 | 3-15 | 10-40 | 80-150 |
| GR (Relative) | 1 | 9 | 100 | 5 |
| ∑ma C.U. | 25.0 | 14.0 | 17.2 | 11.2 |
| Pe | 6.33 | 1.84 | 3.55 | 2.3 |
| (Uma)a | 23.63 | 6.14 | 10.97 | 7.29 |
| (ϕNsh) | 52 | 37 | 30 | 44 |
| (ϕDsh) | -7 | 15 | 8 | 32 |
| (ϕNsh−ϕDsh) | 59 | 22 | 22 | 12 |
| ϕT | 29.5 | 26.0 | 19.0 | 38.0 |
There is no general correlation between the CEC or specific area numbers and any one clay indicator. One approach for determining the clay type from logs is that the least electrically active clays have a large neutron porosity/density difference, and the most active a small one.
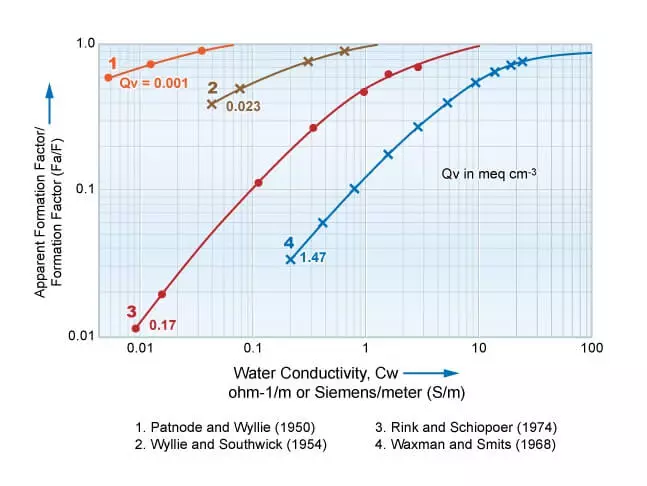
Figure 8 shows the relationship between the water conductivity, Cw, and the apparent formation factor/formation factor,  , which is dependent on both Cw and the shaliness, expressed via the cation exchange capacity (CEC) or specific surface area.
Shaly Sandstone Models for Determining the Water Saturation
The presence of clay and shale in reservoir rock is a major challenge in formation evaluation. Most sandstone contains at least some clay or shale, which reduces the effective porosity, lowers the permeability and alters the resistivity predicted by the basic Archie equation.
Over the years, a large number of petrophysical models relating the resistivity to fluid saturations have been proposed. Many have been developed assuming shale exists in a specific distribution form in the shaly sandstone, such as laminar, structural or dispersed. All these models are composed of a clean sandstone term, described by the Archie water saturation equation, together with a shale term. The shale term, which ranges from fairly simple to very complex, may be relatively independent of, or interact with, the clean sandstone term. All models reduce to the Archie water saturation equation when the fraction of shale drops to zero. For relatively small shale volumes, most models and methods generate similar water saturation results.
Laminar Shale Model
For the laminar shale model, the total rock conductivity is the weighted sum of the conductivities of its two components.

Where:
Ct= total rock conductivity
Csandstone= conductivity of the sandstone element
Csh= conductivity of the shale
Vlam= proportion of the shale laminae within the interval
If Csandstone is considered the traditional Archie equation conductivity, then:

Where:
Sw= water saturation
Rw= formation water resistivity
a and m= parameters in the Archie equation, which are best determined by special core analysis (SCAL)
and

Where Rsh is the resistivity of the shale.
The water saturation, Sw, will be related to the other parameters by the equation:

With rearrangement of this equation to make the water saturation, Sw, the subject, the water saturation in a laminated shale model is given by the equation:
![S_w^n = \left( \dfrac{1}{R_t} - \dfrac{V_{lam}}{R_{sh}} \right)\cdot \left[ \dfrac{a\cdot R_w}{\phi _e^m \cdot (1 - V_{lam})} \right]](https://petroshine.com/wp-content/ql-cache/quicklatex.com-4762f5f3d7c6b724f78efc91950f08ce_l3.png "Rendered by QuickLaTeX.com")
Structural Shale Model
The electrical model for the structural shale case assumes that, in addition to the Archie term, a shale conductivity term can be added so that:

Where:
Rsh= resistivity of the structural shale
Vstr= proportion of the structural shale within the interval
So that the water saturation in a structural shale model is determined using the following equation:

Dispersed Shale Model
The electrical model of the dispersed clay system considers the total porosity, ϕT, to be filled with a mixture of clay slurry of resistivity, Rdis, free formation water of resistivity, Rw, and hydrocarbons, if any are present. Thus, the total formation conductivity is considered to be the sum of an Archie term referred to as the total porosity—both the freely interconnected pores and the clay slurry-filled pores—and a clay conductivity term that depends on both water saturation and the clay fraction.
For the dispersed shale case, the water saturation equation may be written as:

Where:
Ct= total conductivity
ϕT= total porosity
SwT= total water saturation
Vdis= proportion of dispersed shale within the interval
Rdis= resistivity of the dispersed shale
Rw= resistivity of the formation water
a and m= parameters used in the Archie equation, which are best determined by special core analysis (SCAL)
So that the effective water saturation, Swe, in a dispersed shale model is determined using the following equation:

Where:
Swe= effective water saturation
ϕe= true porosity in the clean sandstone
The key to successful log analysis in these complex formations lies in finding the optimum petrophysical model for the specific formation being analyzed. What is sometimes lacking is a coherent theory to explain the observations, together with the appropriate logging tools to make the necessary measurements.
Total Shale Relationships
When there is doubt as to the actual distribution of shale and clay in the formation, an alternative interpretation approach is to use one of the so-called “total shale relationships” that are non-specific as to the type of shale model. Although only some of these relationships are based on a sound experimental basis, one of the most widely used is this modified total shale relationship:

Worked Sandstone Example