Related Articles


Pyrochromatography and Fluorescence Spectroscopy
Two methods for distinguishing gas productive, oil productive and non-productive zones are pyrochromatography and fluorescence spectroscopy.
Pyrochromatography
Pyrochromatography, sometimes called thermal extraction chromatography, is derived from the process in which heat is applied in a controlled manner to small hydrocarbon-saturated rock samples, which causes the fluids to leave the core sample and be swept into a chromatograph for “fingerprinting.” These data are helpful in providing a distinction between gas productive, oil productive and non-productive zones. An important application of this procedure is in evaluating reef formations. Its application requires the use of production as well as other conventional well evaluation data to establish working correlations.
Figure 1 displays chromatographic fingerprints for both a non-productive and an oil productive formation.

The oil productive formation is characterized by high percentages of C15 through C19, and significant percentages of C20 and above. It can be noted that essentially all of the hydrocarbons lower than C8 are missing. This indicates that the rock has permeability and that these light components vaporized and escaped on the trip up to the surface. Another important indicator is the total hydrocarbon quantity in the sample (the area under the curve), which is sufficient in this case to indicate oil production.
The non-productive example shown in Figure 1 has less total hydrocarbon in the core and a high percentage of C8 and lower. This indicates that the rock contained little residual hydrocarbons and was of such poor quality that the lighter hydrocarbons could not readily escape as the core moved to the surface.
The thermal extraction chromatography technique is also used in the analysis of drill cuttings to evaluate the source rock quality.
Fluorescence Spectroscopy
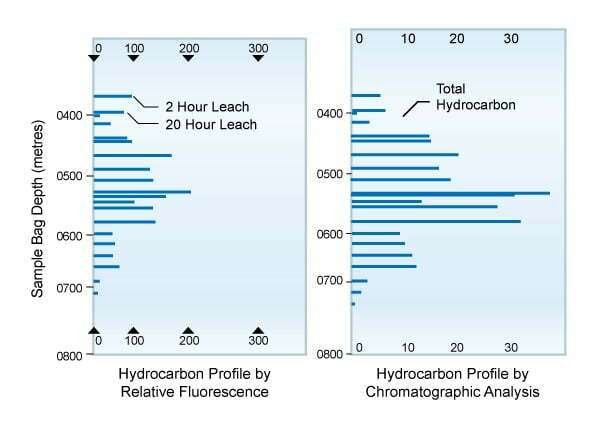
Another method for distinguishing gas productive, oil productive and non-productive zones is fluorescence spectroscopy. Portions of the rock are placed in a chemical solvent to leach out the residual hydrocarbons. Fluorescence measurements of the leached solution are taken at predetermined time intervals with a fluorescence spectrometer, or fluorimeter, to determine the relative levels of fluorescence. This provides an indication of how rapidly the available hydrocarbons are extracted from the rock, which in turn is an indication of the permeability of the samples. Fluorescence data can then be plotted by depth to identify those wellbore intervals that do and do not exhibit fluorescence. Figure 2 is an example of a comparison between fluorescence and chromatographic analysis and includes a prediction of the gas, oil and water zones.