Related Articles


Learning Objectives
After completing this topic “Core Information”, you will be able to:
- Describe the different types of data and core information obtained as a complement to routine, special core analysis (SCAL) and the standard core description.
- State the purpose of each type of complementary core information.
- Describe the methods used for determining each type of complementary core information.
Grain Density
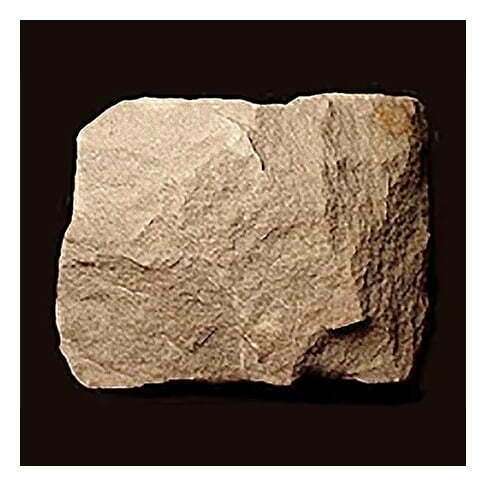
The grain density of a rock is defined as the weight of the rock (exclusive of the weight of the fluids contained within the pore spaces) divided by the volume of the solid rock material (exclusive of the pore spaces). The grain density primarily varies with the mineral composition of the rock and the state of hydration of the minerals. In complex lithologies containing intermixed limestone, dolomite, sandstones and heavy minerals, the grain density will vary both vertically and horizontally. Even in formations described as homogeneous (Figure 1), the measured grain densities often vary considerably from the published values for the pure components (Table 1).
| Component | Approximate grain density ( ) ) |
|---|---|
| Sandstone | 2.65 |
| Limestone | 2.71 |
| Dolomite | 2.85-2.87 |
| Anhydrite | 2.98 |
| Gypsum | 2.3 |
| Pyrite | 5.0 |
| Siderite | 3.9 |
| Clays | 2.2 – 2.9 |
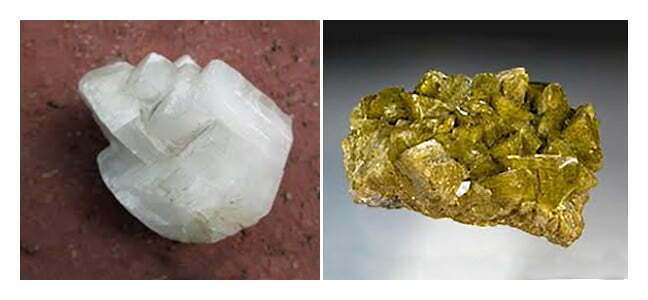
Minor amounts of secondary cement, such as calcite or siderite (Figure 2), will cause the grain densities to vary from the values shown in the table.
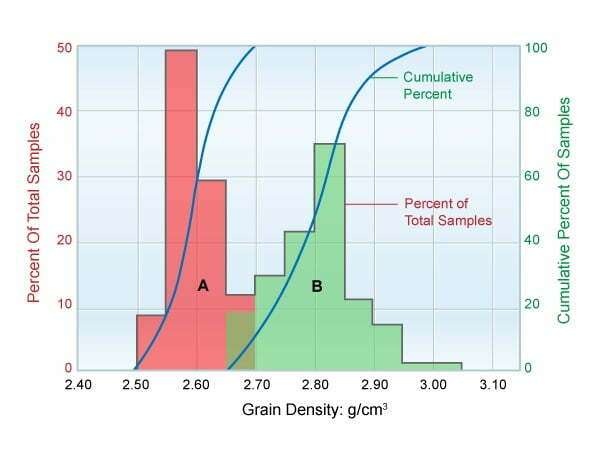
An example of the variance in inter-well and intra-well differences recorded in one study is shown in Figure 3.
Grain density is important complementary core information for two main reasons. First, it can be used as a quality control check of the core analysis measurements. Second, a value for grain density is a required input to the equation used to calculate the porosity from the bulk density value sensed by the wireline and/or LWD logging tools. The equation takes the form:

Where:
GD = Grain Density, () (assumed or measured)
BD = Bulk Density, () (from downhole log)
FD = Fluid Density, () (assumed)
ϕ = Porosity, fractional
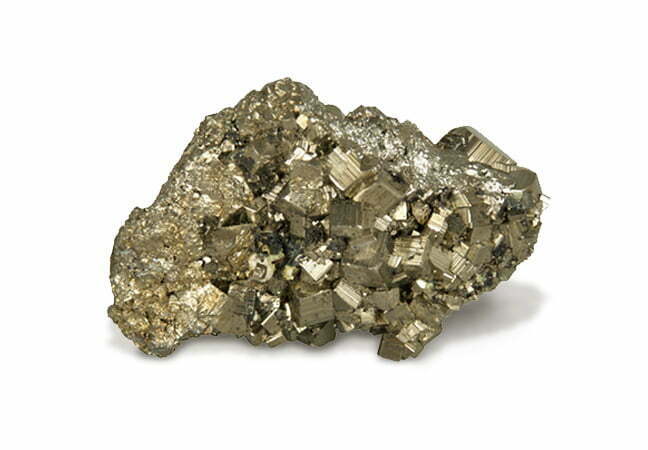
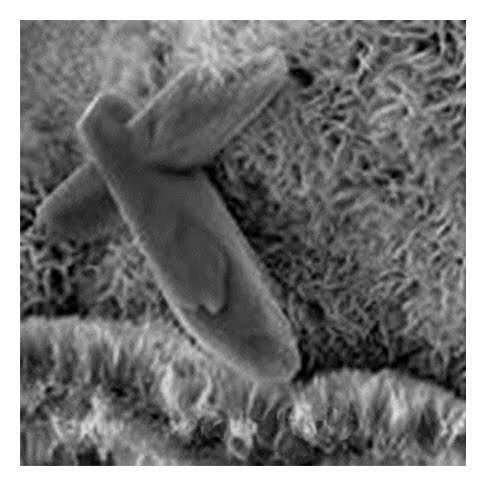
The general rule is that impurities in the rock increase its grain density. Grain density values that exceed the estimated values for the pure components occur when carbonate cements are present, or when relatively heavy impurities such as pyrite (Figure 4) or siderite are present within the pore spaces. Values can occasionally exceed 3.0 (). In these cases, using erroneously low grain densities will generate calculated values of well log porosity that are too low. This potential error is most critical when evaluating low porosity rock, as even small errors result in significantly lower porosity estimates. When an erroneously low porosity value is substituted into water saturation equations that use the well log resistivity data, the calculated water saturations are too high. A combination of such underestimated porosity and overestimated water saturations can cause the calculated oil-in-place to be underestimated by up to 25%.
An exception to the general rule that impurities in the rock increase its grain density is with core samples that contain large quantities of hydratable clays (Figure 5). When such a sample is dried in a humidity oven, the two molecular layers of water are maintained on the clay surfaces, and the calculated grain density has a lower value than the rock itself. Removal of this water, which can occur when the sample is dried in a non-humidity oven, increases the grain density.
When core analysis grain densities are reported, it is important to know how the samples were prepared (Actlabs, 2014). In some analyses, the grain density is measured with all the bound water removed from the clay surfaces of the samples; in other analyses, the grain densities and porosities are measured with this water still in place.
After the core has been cleaned and dried to specifications, the measured grain density is accurate to ±0.01().
